
Bitcoin chain indicator analysis: the nine-finger cap chart suggests that the bull market is still accumulating strength
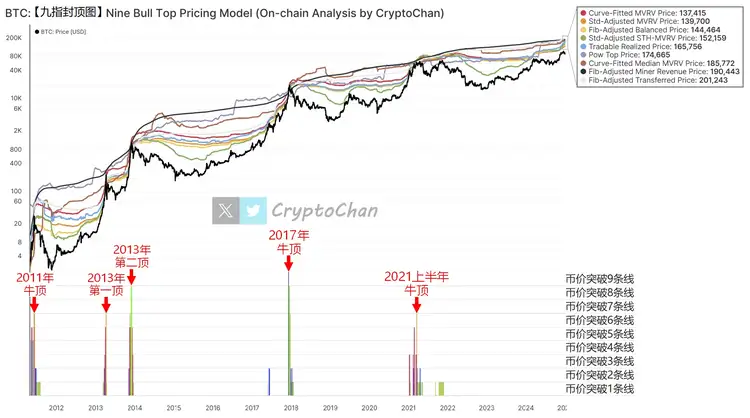
- 2011 bull market peak: Bitcoin price breaks through 6 reference lines.
- The first peak in 2013: Bitcoin price broke through six reference lines.
- The second peak in 2013: Bitcoin price broke through 8 reference lines.
- 2017 bull market peak: Bitcoin price breaks through 9 reference lines, reaching the chart limit.
- The bull market peak in the first half of 2021: Bitcoin price broke through 6 reference lines again.
- 🔴 Curve-Fitted MVRV Price: $137,415
- 🟠 Std-Adjusted MVRV Price: $139,700
- 🟡 Fib-Adjusted Balanced Price: $144,464
- 🟢 Std-Adjusted STH-MVRV Price: $152,159
- 🔵 Tradable Realized Price: $165,756
- 🟣 Pow Top Price: $174,665
- 🟤 Curve-Fitted Median MVRV Price: $185,772
- ⚫ Fib-Adjusted Miner Revenue Price: $190,443
- ⚪️ Fib-Adjusted Transferred Price: $201,243
Disclaimer: The content of this article solely reflects the author's opinion and does not represent the platform in any capacity. This article is not intended to serve as a reference for making investment decisions.
You may also like
Weekly Hot Picks: The Fed Cuts Rates and Indirectly "Injects Liquidity"! Silver Replaces Gold as the New Favorite?
The Federal Reserve is cutting interest rates and starting bond purchases, while Japan and other regions may turn to rate hikes. Silver repeatedly hits record highs, SpaceX is set for a 1.5 trillion IPO, and Oracle becomes the litmus test for the AI bubble. The Russia-Ukraine peace process is stuck on territorial issues, the US seizes a Venezuelan oil tanker... What exciting market events did you miss this week?

Key Highlights to Watch at Solana Breakpoint 2025
How does Solana seize market share in an increasingly competitive landscape?

Crucial Alert: ZRO Leads This Week’s $100M+ Token Unlocks – What Investors Must Know
Revealed: Why Tether’s $1.1 Billion Juventus Acquisition Bid Was Rejected