
Solana Price Prediction: Can SOL Break $170 This Week?

Solana (SOL) price is starting the week strong , showing promising signs of recovery after a turbulent end to May. Based on the latest daily and hourly TradingView charts, SOL is attempting a breakout while fighting overhead resistance. With key moving averages tightening and bullish momentum visible, traders are watching closely to see if SOL price can extend toward the $170–$180 zone. Here's a breakdown of what the charts are telling us.
Solana Price Prediction: Is SOL Price Gearing Up for a Short-Term Rally?
 SOL/USD 1 Hr Chart- TradingView
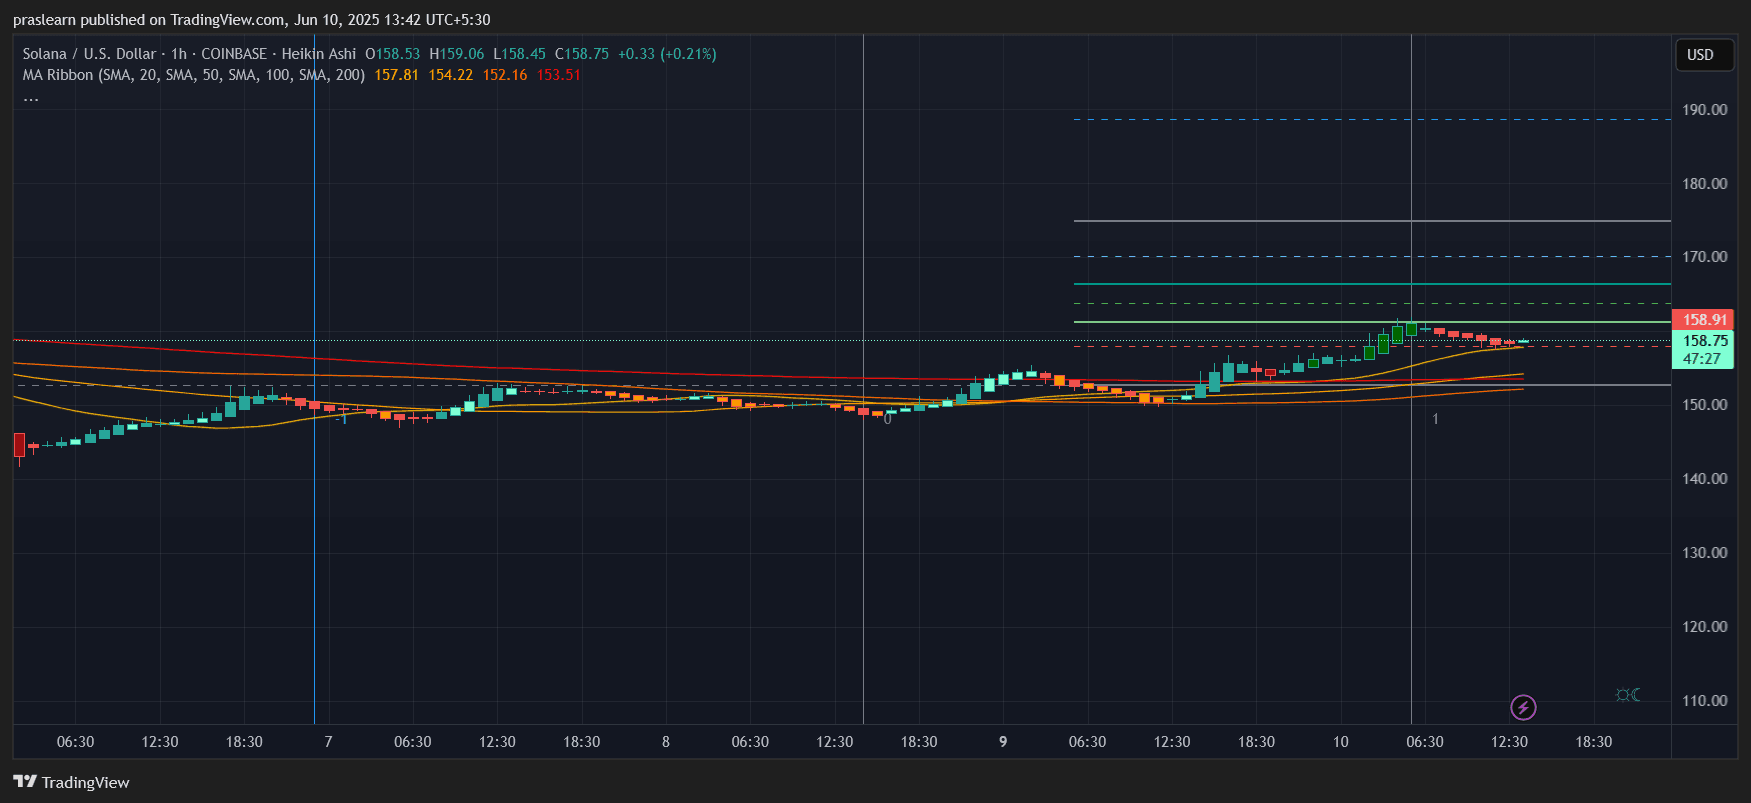
The 1-hour chart for Solana price shows a clear bullish crossover on the MA Ribbon. The price is currently trading above the 20, 50, 100, and 200 SMAs, with the 200 SMA lagging behind at around $153.51. SOL is holding above this entire band, with the price at $158.75, indicating short-term bullish strength.
Notably, the Heikin Ashi candles are still printing green, but they are showing smaller bodies and longer upper wicks—suggesting a temporary slowdown in momentum. Still, the structure remains bullish unless SOL closes below the $153–$155 support zone. The Fibonacci levels show a near-term target around $165, followed by $172. Using the hourly chart’s base range of $150 to $158, a Fibonacci extension of 1.618 projects $171.65—well within striking distance if buying volume increases.
Is the Daily Chart Supporting a Bigger Breakout?
 SOL/USD 1 Day Chart- TradingView
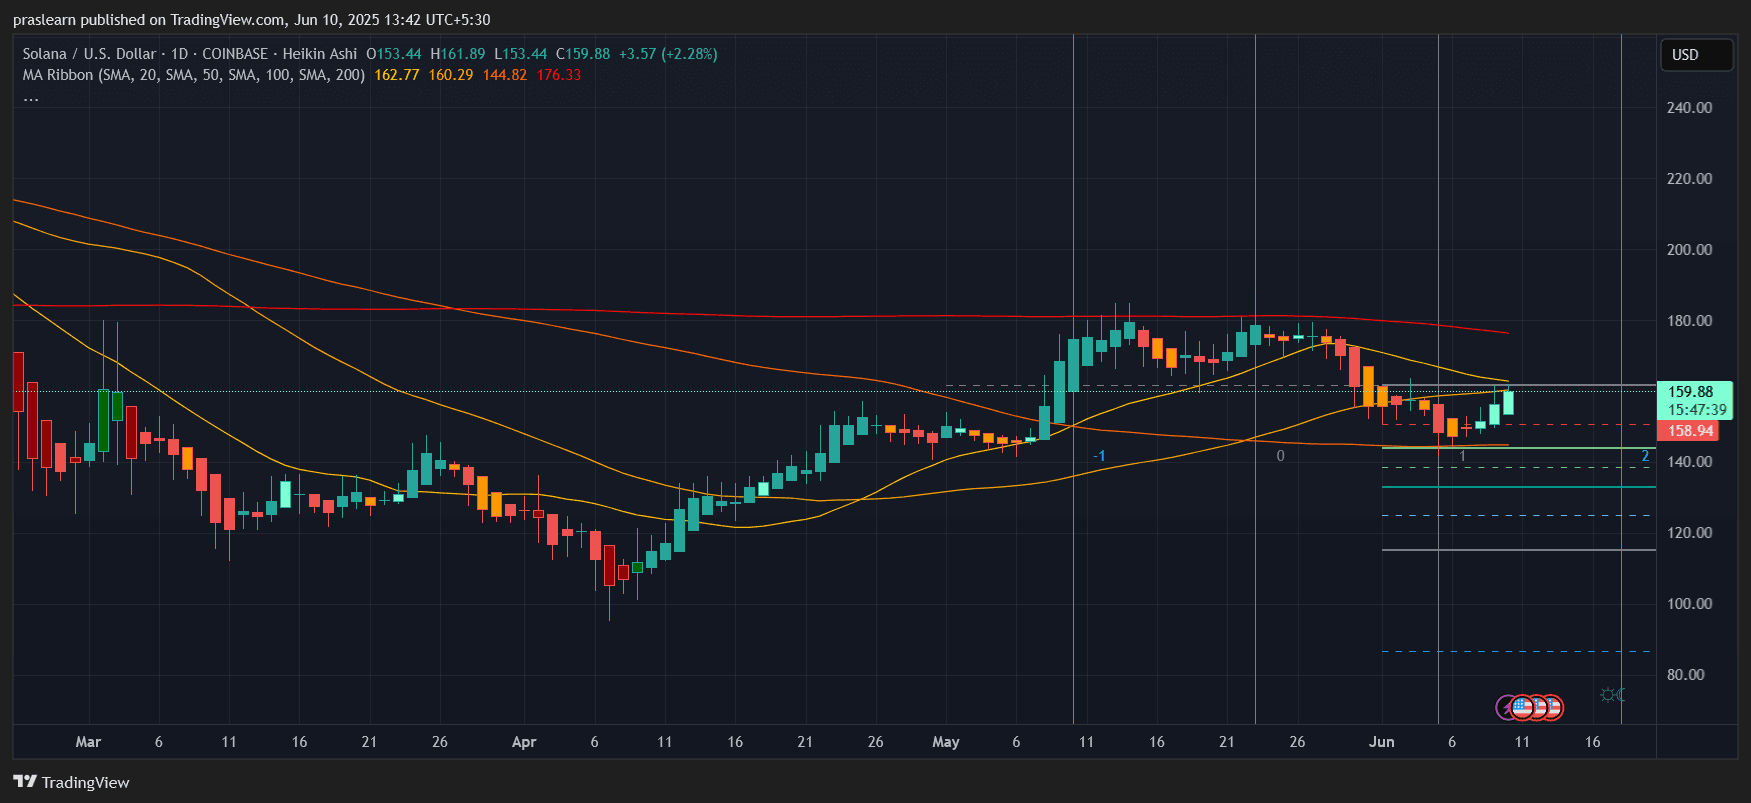
The daily chart reveals a stronger, more structural development. After falling from May highs near $188, SOL price found support at the 100 SMA ($144.82), which aligns with Fibonacci support levels. The recent bounce from that zone has pushed SOL back up to $159.88, with a daily gain of +2.28%.
Importantly, SOL price is now attempting to flip the 20-day SMA ($160.29) and 50-day SMA ($162.77) into support. This confluence creates a key battleground zone between $160–$163. A daily close above this range could attract a fresh wave of buyers. If that happens, the next target is the 200 SMA at $176.33.
Let’s do a quick calculation:
If Solana price maintains a $5 daily gain (as it did in the last 24 hours) and breaks $163 resistance by mid-week, then:
$159.88 + ($5 × 3 days) = $174.88 by Thursday, testing the 200 SMA and possibly triggering FOMO among swing traders.
What Are the Key Support and Resistance Levels to Watch?
- Immediate resistance sits at $160–$163, which includes short-term SMAs and recent price rejection zones. A successful breakout above this area opens up room toward $170 and then $176.
- Strong support lies near $144. If SOL price breaks below $152 (the 100-hour SMA zone), bears could regain control and push the price back to $140–$145. The long-term bullish thesis holds only if $140 remains intact as a base.
Solana Price Prediction: Will SOL Price Break $170 This Week?
There’s a decent probability. The hourly chart suggests a short-term bullish continuation, while the daily chart shows a larger pattern forming that could lead to a breakout if Solana price holds above the moving average cluster. The 20- and 50-day SMAs converging indicate that a “Golden Cross” setup could be near—a historically bullish signal.
Considering the momentum, Fibonacci targets, and moving average dynamics, a move toward $170–$175 is realistic by this weekend if BTC stays above $100K and broader crypto sentiment remains positive.
Final Thoughts
Solana price is not just recovering —it’s showing technical signs of strength across both short-term and mid-term timeframes. If buyers defend $155 and flip $160–$163 into support, we could be looking at a breakout week. Traders should closely monitor volume surges and 4-hour candle confirmations to ride this move.
If $160 holds, Solana price can rally to $171–$175 this week. However, a failure to maintain $153 could drag the SOL price back to $144. Risk is manageable, but momentum is clearly shifting toward the bulls.
$SOL, $Solana
Solana (SOL) price is starting the week strong , showing promising signs of recovery after a turbulent end to May. Based on the latest daily and hourly TradingView charts, SOL is attempting a breakout while fighting overhead resistance. With key moving averages tightening and bullish momentum visible, traders are watching closely to see if SOL price can extend toward the $170–$180 zone. Here's a breakdown of what the charts are telling us.
Solana Price Prediction: Is SOL Price Gearing Up for a Short-Term Rally?
SOL/USD 1 Hr Chart- TradingView
The 1-hour chart for Solana price shows a clear bullish crossover on the MA Ribbon. The price is currently trading above the 20, 50, 100, and 200 SMAs, with the 200 SMA lagging behind at around $153.51. SOL is holding above this entire band, with the price at $158.75, indicating short-term bullish strength.
Notably, the Heikin Ashi candles are still printing green, but they are showing smaller bodies and longer upper wicks—suggesting a temporary slowdown in momentum. Still, the structure remains bullish unless SOL closes below the $153–$155 support zone. The Fibonacci levels show a near-term target around $165, followed by $172. Using the hourly chart’s base range of $150 to $158, a Fibonacci extension of 1.618 projects $171.65—well within striking distance if buying volume increases.
Is the Daily Chart Supporting a Bigger Breakout?
SOL/USD 1 Day Chart- TradingView
The daily chart reveals a stronger, more structural development. After falling from May highs near $188, SOL price found support at the 100 SMA ($144.82), which aligns with Fibonacci support levels. The recent bounce from that zone has pushed SOL back up to $159.88, with a daily gain of +2.28%.
Importantly, SOL price is now attempting to flip the 20-day SMA ($160.29) and 50-day SMA ($162.77) into support. This confluence creates a key battleground zone between $160–$163. A daily close above this range could attract a fresh wave of buyers. If that happens, the next target is the 200 SMA at $176.33.
Let’s do a quick calculation:
If Solana price maintains a $5 daily gain (as it did in the last 24 hours) and breaks $163 resistance by mid-week, then:
$159.88 + ($5 × 3 days) = $174.88 by Thursday, testing the 200 SMA and possibly triggering FOMO among swing traders.
What Are the Key Support and Resistance Levels to Watch?
- Immediate resistance sits at $160–$163, which includes short-term SMAs and recent price rejection zones. A successful breakout above this area opens up room toward $170 and then $176.
- Strong support lies near $144. If SOL price breaks below $152 (the 100-hour SMA zone), bears could regain control and push the price back to $140–$145. The long-term bullish thesis holds only if $140 remains intact as a base.
Solana Price Prediction: Will SOL Price Break $170 This Week?
There’s a decent probability. The hourly chart suggests a short-term bullish continuation, while the daily chart shows a larger pattern forming that could lead to a breakout if Solana price holds above the moving average cluster. The 20- and 50-day SMAs converging indicate that a “Golden Cross” setup could be near—a historically bullish signal.
Considering the momentum, Fibonacci targets, and moving average dynamics, a move toward $170–$175 is realistic by this weekend if BTC stays above $100K and broader crypto sentiment remains positive.
Final Thoughts
Solana price is not just recovering —it’s showing technical signs of strength across both short-term and mid-term timeframes. If buyers defend $155 and flip $160–$163 into support, we could be looking at a breakout week. Traders should closely monitor volume surges and 4-hour candle confirmations to ride this move.
If $160 holds, Solana price can rally to $171–$175 this week. However, a failure to maintain $153 could drag the SOL price back to $144. Risk is manageable, but momentum is clearly shifting toward the bulls.
$SOL, $Solana
Disclaimer: The content of this article solely reflects the author's opinion and does not represent the platform in any capacity. This article is not intended to serve as a reference for making investment decisions.
You may also like
This Week's Preview: Macro "Flood Release" Week—Delayed CPI and the Bank of Japan's "Rate Hike Pursuit"
Key global market data will be released this week, including the U.S. non-farm payroll report, CPI inflation data, and the Bank of Japan's interest rate decision, all of which will significantly impact market liquidity. Bitcoin prices are fluctuating due to macroeconomic factors, while institutions such as Coinbase and HashKey are striving to break through via innovation and public listings. Summary generated by Mars AI This summary was generated by the Mars AI model. Its accuracy and completeness are still being iteratively improved.

Weekly Hot Picks: The Fed Cuts Rates and Indirectly "Injects Liquidity"! Silver Replaces Gold as the New Favorite?
The Federal Reserve is cutting interest rates and starting bond purchases, while Japan and other regions may turn to rate hikes. Silver repeatedly hits record highs, SpaceX is set for a 1.5 trillion IPO, and Oracle becomes the litmus test for the AI bubble. The Russia-Ukraine peace process is stuck on territorial issues, the US seizes a Venezuelan oil tanker... What exciting market events did you miss this week?

Key Highlights to Watch at Solana Breakpoint 2025
How does Solana seize market share in an increasingly competitive landscape?

Crucial Alert: ZRO Leads This Week’s $100M+ Token Unlocks – What Investors Must Know