

Date: Mon, Sept 08, 2025 | 05:20 AM GMT
The cryptocurrency market is showing notable strength, with Ethereum (ETH) holding resilience around the $4,300 mark after retreating from its recent peak of $4,953. Following this stability, several major altcoins are beginning to show signs of upside potential — including Kaspa (KAS).
KAS is back in the green today, and more importantly, its latest chart structure suggests that more upside could be on the horizon.
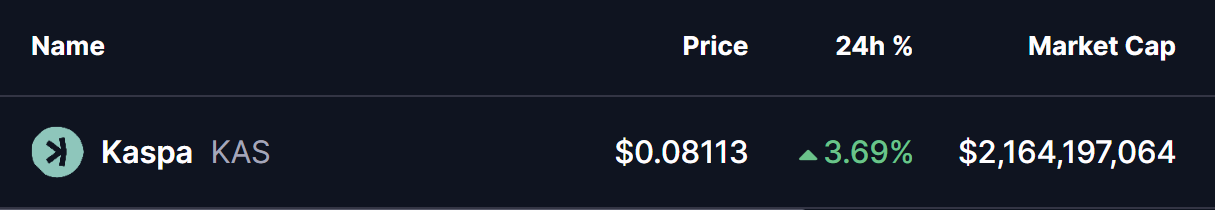 Source: Coinmarketcap
Harmonic Pattern Hints at Potential Upside
On the daily chart, KAS is forming a Bearish Butterfly harmonic pattern. Despite its name, this setup often delivers a bullish continuation during the CD leg, especially when price action heads into the Potential Reversal Zone (PRZ).
The structure started at point X ($0.1315), dipped to A, rallied to B, and then retraced to C near $0.0728. From there, KAS has started recovering, now trading around $0.0812, though it remains in the early stages of confirming a bullish leg higher.
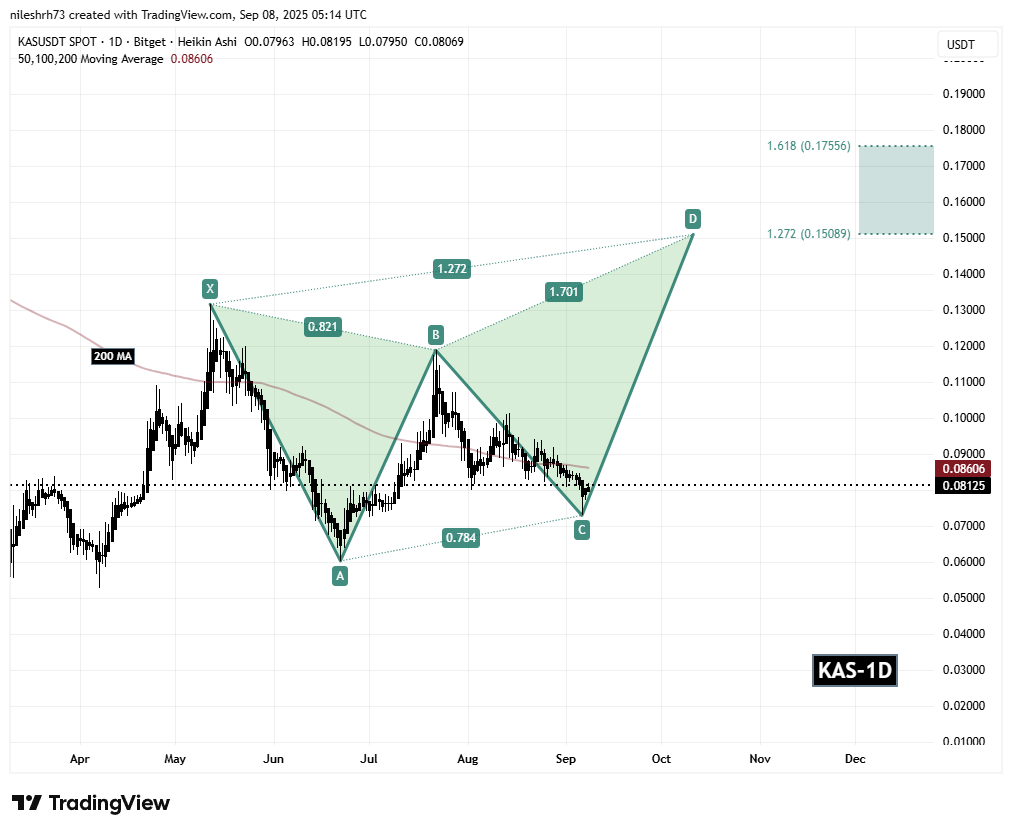 Kaspa (KAS) Daily Chart/Coinsprobe (Source: Tradingview)
A key factor to watch is the 200-day moving average ($0.0860), which currently acts as resistance. A decisive breakout and close above this level could flip it into support, further boosting bullish sentiment.
What’s Next for KAS?
If bulls manage to defend the C-point support at $0.0728 and sustain momentum, KAS could rally toward the PRZ between $0.1508 (1.272 Fibonacci extension) and $0.1755 (1.618 extension). These levels align with the Butterfly completion zone and serve as key upside targets in the short term.
However, confirmation is key — until KAS reclaims its 200-day MA, the possibility of further consolidation cannot be ruled out.
![Solana [SOL] stalls at range highs as market panic overrides capital inflows](https://img.bgstatic.com/spider-data/864083153c8d2118fd81ea1a2ebacf611772326992214.png)
