
Polkadot’s Unexpected Comeback: A Potential Market Upswing

After a sluggish performance, Polkadot (DOT) is signaling a robust recovery, hinted at by recent analyses. It appears to be entering the “Spring” phase outlined in the Wyckoff methodology, a prominent framework used to predict trend reversals. This phase often suggests that the market is primed for an upswing from a prolonged downturn.
How Does DOT’s Price Behavior Reflect Market Dynamics?
Following a steep decline at the start of December, Polkadot’s price showed a strong buying response near the $2 benchmark. This shift in market behavior, marked by a long lower wick, indicates a temporary breach of selling pressure, followed by intense buying activity. This pattern aligns with the Spring phase’s characteristics, where a sharp drop below support levels shakes out weak holders, paving the way for a rebound.
What Role Does the Wyckoff Method Play in DOT’s Outlook?
DOT’s recent movements suggest the formation of an accumulation pattern since 2023, consistent with the Spring framework. Analysts predict that a break beyond the $2.30 to $2.50 range may denote a significant “Sign of Strength,” with potential upward targets stretching between $12 and $15. The next phase involves achieving higher levels, contingent on DOT sustaining breaks above middle-range resistances.
The ongoing price patterns for DOT can be effectively understood within Wyckoff’s roadmap, which involves several distinct phases:
- SC (Selling Climax): The primary phase of high-volume sell-off
- ST (Secondary Test): A reassessment of support levels
- AR (Automatic Rally): An initial robust rebound
- Spring: An ultimate dip below support; DOT’s presumed current stage
- LPS (Last Point of Support): Emergence of higher low points
- SOS (Sign of Strength): Start of upward momentum following resistance breakthrough
Aligning with these technical insights, Polkadot’s ecosystem is witnessing heightened developmental activities. Analysis from blockchain platforms underscores Polkadot’s status as a dynamic player in the Web3 development space. This activity boosts confidence in its long-term growth potential despite short-term price challenges.
Polkadot is demonstrating a promising structural transition, but confirmation hinges on surpassing key resistance points, indicating potential for a significant price escalation.
Polkadot’s current chart patterns suggest progression through the later stages of an accumulation cycle. While the Spring phase might suggest a promising reversal, real validation lies in breaching resistance levels—a crucial factor for stakeholders to monitor closely.
Disclaimer: The content of this article solely reflects the author's opinion and does not represent the platform in any capacity. This article is not intended to serve as a reference for making investment decisions.
You may also like

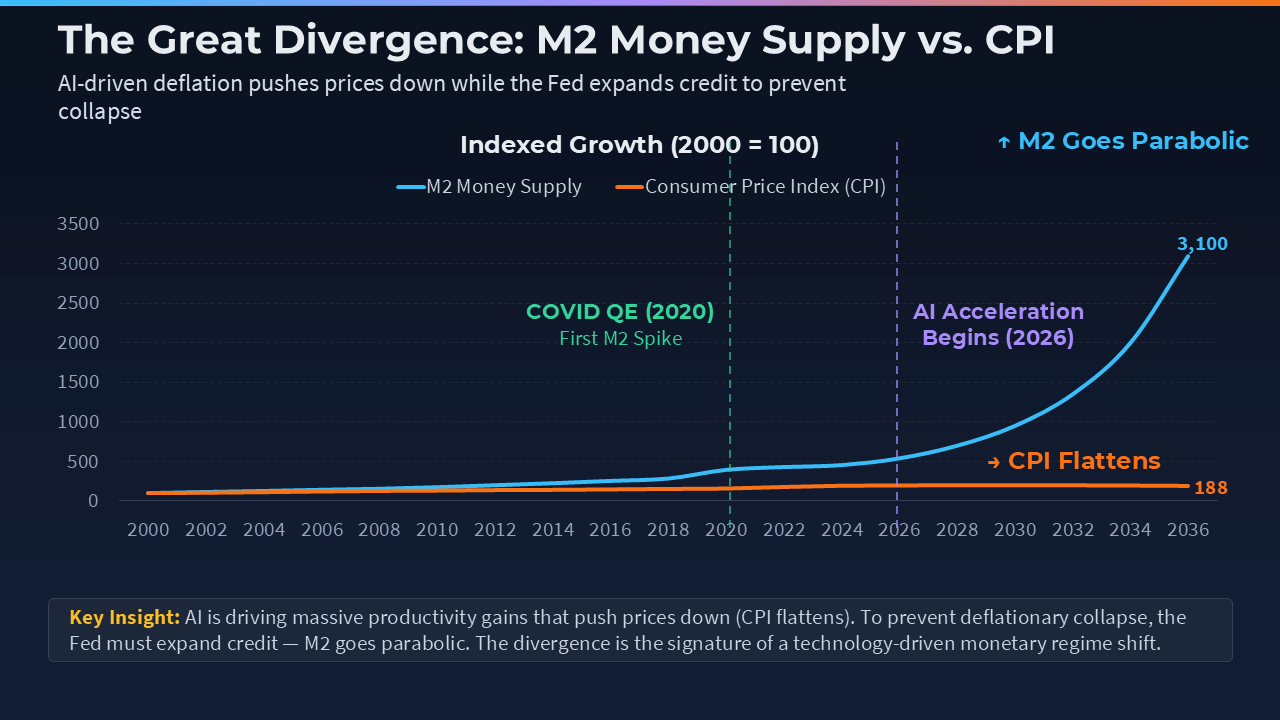
Strive strategist says AI deflation could push Bitcoin to $11M by 2036
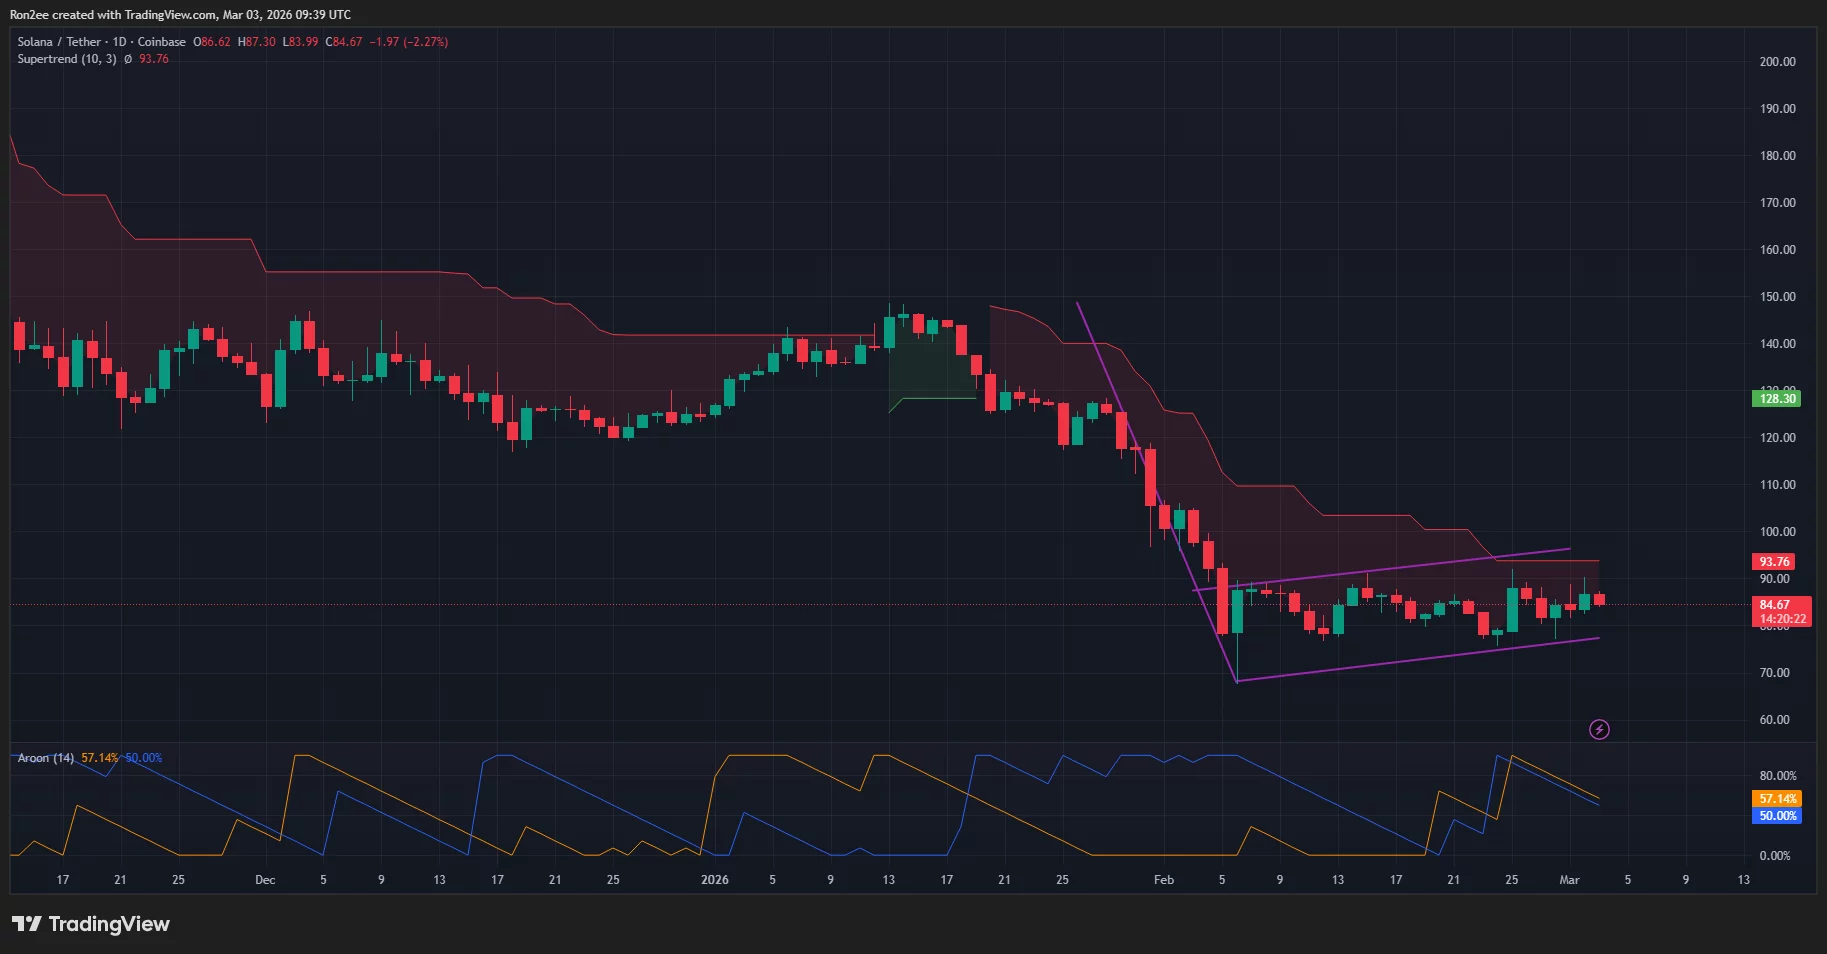
Will Solana price crash now that it has charted a bearish flag pattern?
Brent: Disruption risks and tight prompt market – ING