Hedera Tumbles 4% as Altcoins Continue to Suffer

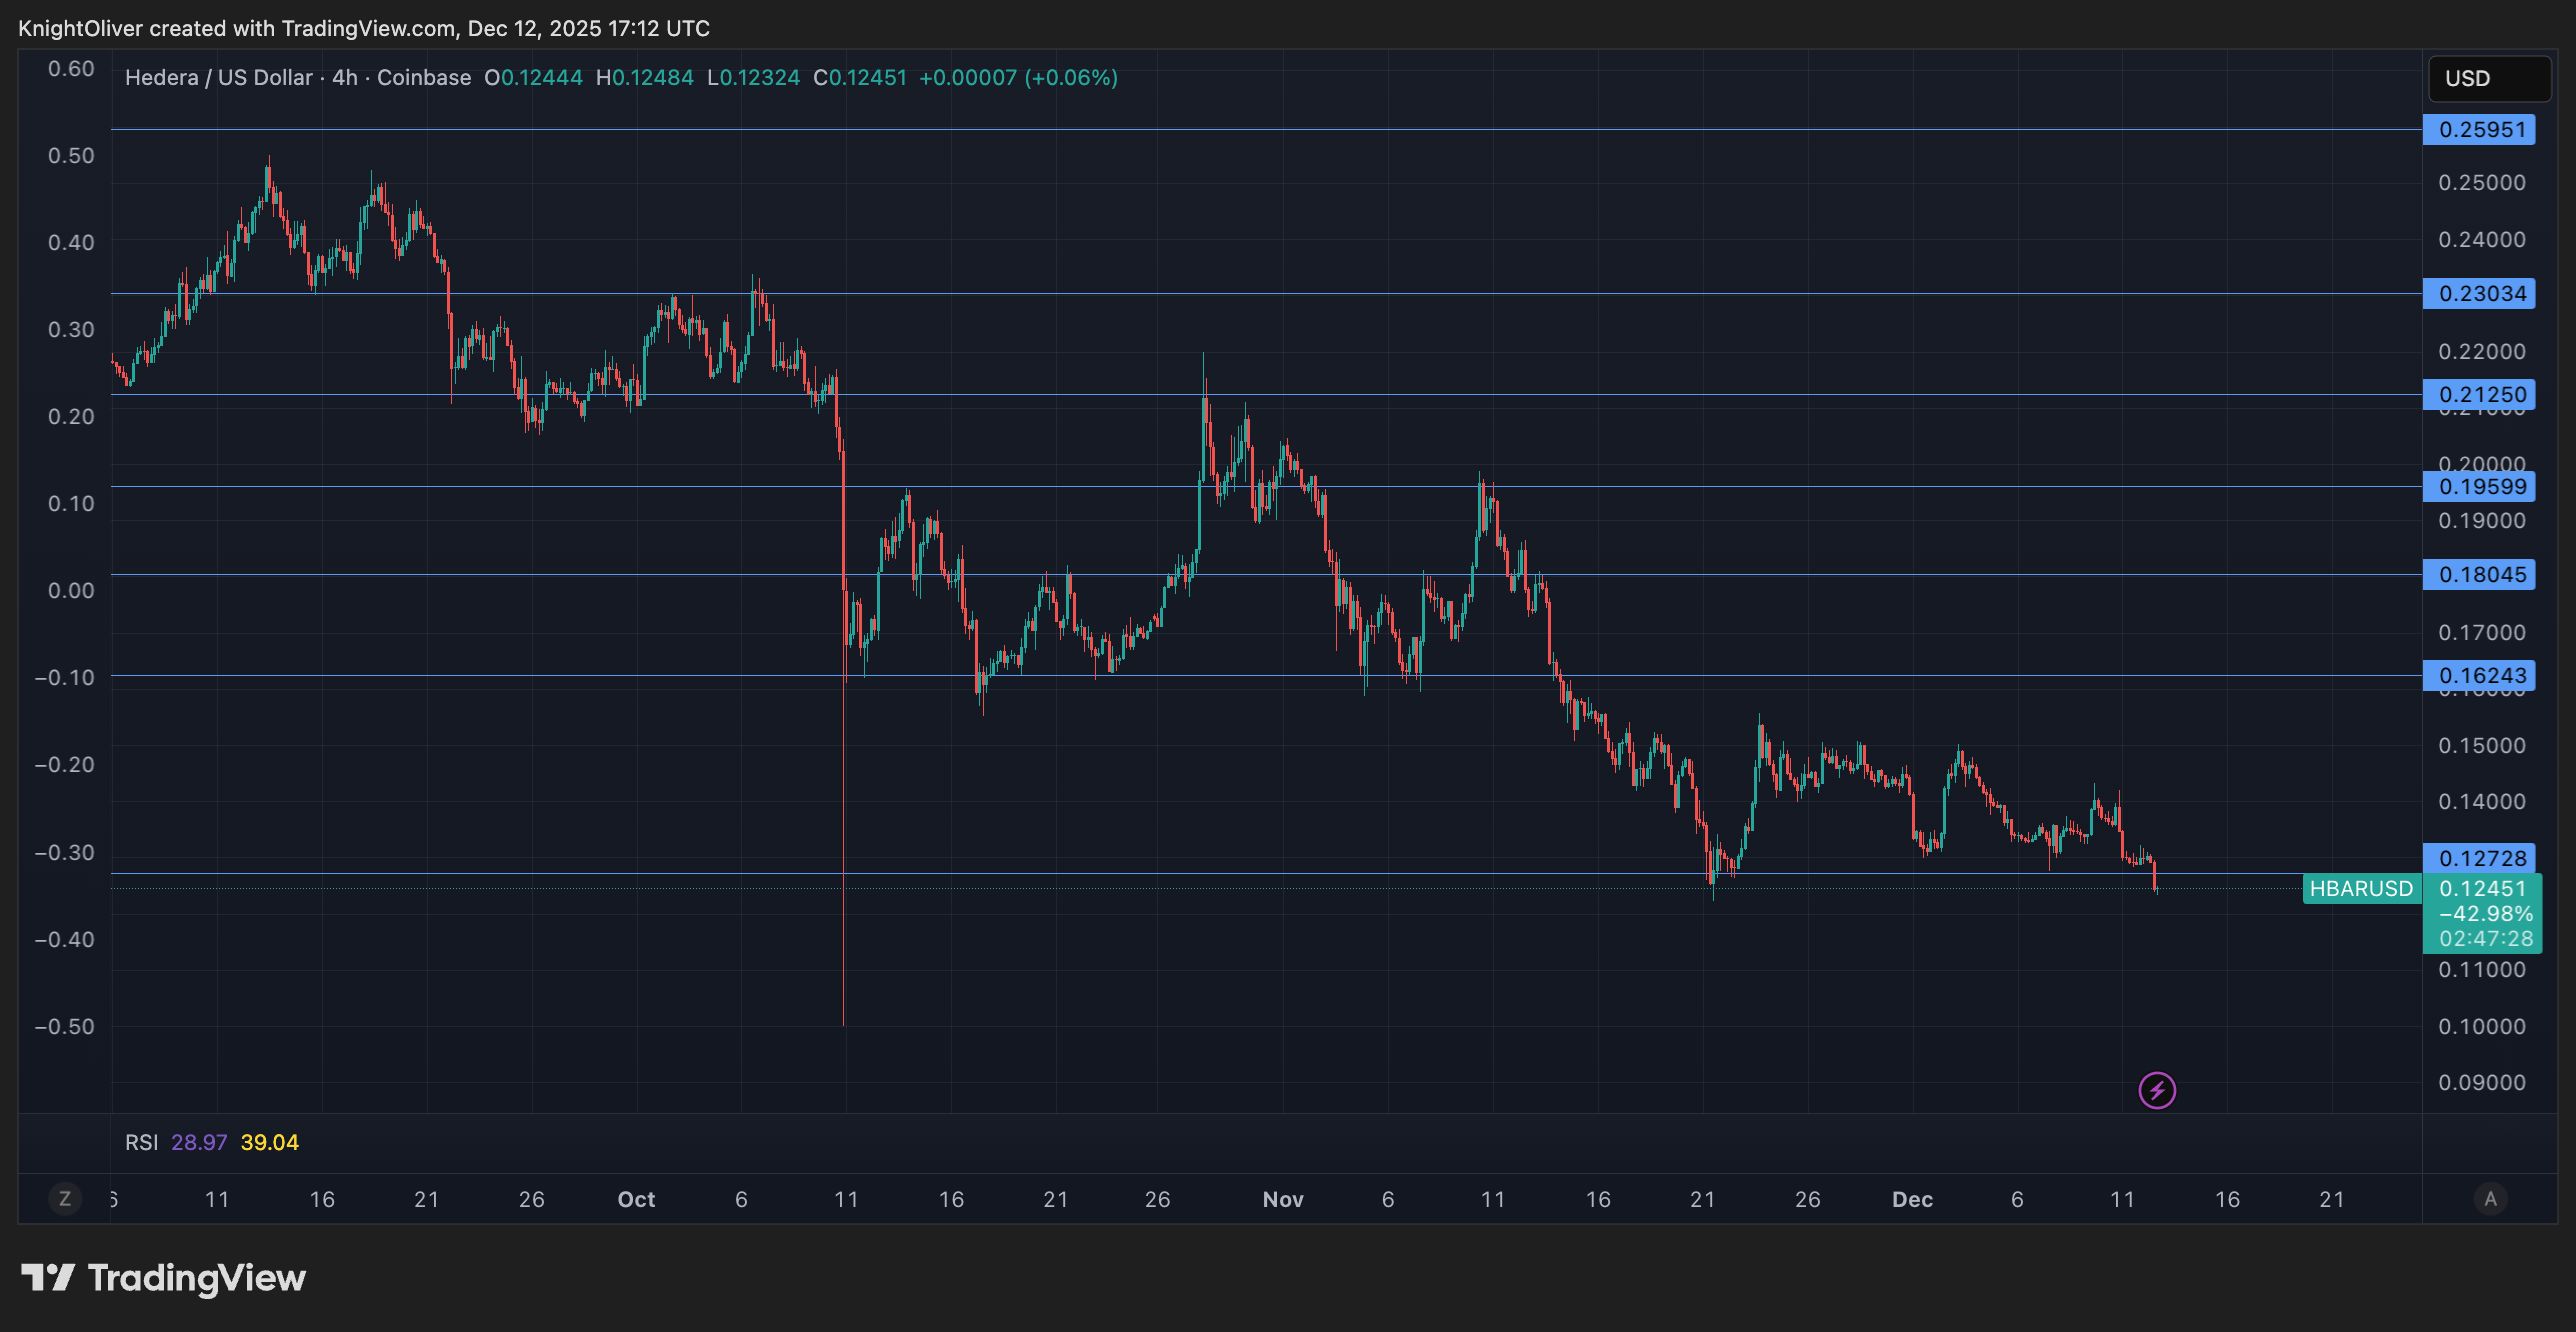
HBAR trades lower Thursday after breaking through multiple technical levels during an afternoon selloff that pushed the token down 4% to $0.1247.
The native token of the Hedera network posts a $0.0082 range representing 6.4% volatility as resistance at $0.1320 proves insurmountable for bulls attempting to extend gains.
Volume patterns reveal heightened institutional participation throughout the session. The surge in trading activity confirms genuine price discovery rather than low-liquidity movements characteristic of smaller altcoins.
The afternoon cascade establishes a clear lower high pattern from the initial Dec. 11 spike, creating deteriorating market structure that accelerates downward momentum through previously established support zones.
Technical levels at $0.1235 become paramount as HBAR tests critical support following rejection at $0.1320 resistance.
The stabilization pattern around $0.124-$0.125 following dramatic capitulation creates potential for mean reversion back to $0.126 resistance.
Traders remain cautious given the decisive break of higher timeframe support levels and exceptional volume during the decline that indicates conviction selling. This limits near-term upside potential despite the immediate price recovery that brings some relief to bulls.
Key technical levels signal consolidation range for HBAR
Support/Resistance:
- Immediate support established at $0.1235 following afternoon decline.
- Strong resistance confirmed at $0.1320 after multiple rejection attempts.
- New trading range between $0.123-$0.125 on 60-minute timeframes.
Volume Analysis:
- Exceptional surge to 165.9 million tokens (175% above 24-hour average) during key reversal.
- 60-minute flash crash volume peaked at 15.7 million (700% above hourly average).
- Sustained above-average activity confirming institutional participation.
Chart Patterns:
- Lower highs pattern established from Dec. 11 peak creating bearish structure.
- Flash crash and recovery formation suggesting accumulation near support.
- Deteriorating momentum through multiple support levels indicating trend shift.
Targets & Risk/Reward:
- Immediate upside target at $0.126 mean reversion level.
- Downside risk to $0.123 support floor if current consolidation fails.
- Key resistance remains $0.1285 where initial breakdown occurred.
Disclaimer: The content of this article solely reflects the author's opinion and does not represent the platform in any capacity. This article is not intended to serve as a reference for making investment decisions.
You may also like
Agilent Technologies, Inc. (A) Price Target Cut to $155 at Baird

DraftKings, ESPN Launch Account Linking, 'Bet Your Bracket' Ahead Of March Madness
Orion Properties’ Leasing Pipeline and Success Rate Signals Don’t Match in 2025 Earnings Calls
Is BlackRock, Inc. (BLK) One of the Stocks that could Skyrocket in 2026?