
WTI Price Outlook: Buyers challenge $60 amid strengthening momentum

WTI Crude Oil Recovers Amid Supply Disruptions
On Tuesday, West Texas Intermediate (WTI) Crude Oil continued its upward movement, buoyed by renewed worries over supply after production issues at Kazakhstan’s Tengiz oil field interrupted output. As of the latest update, WTI is trading around $60.33, reflecting a gain of approximately 1.6% for the session.
Simultaneously, intensifying trade disputes between the United States and the European Union have put pressure on the US Dollar (USD). This decline in the dollar’s value has made oil priced in USD more affordable for international buyers, providing additional support for crude prices.
From a technical perspective, the outlook for WTI is becoming more positive as momentum picks up following a recent period of weakness.
Technical Analysis: Key Levels and Indicators
Examining the daily chart, WTI is currently challenging the 100-day Simple Moving Average (SMA) near $59.84, having recently stabilized above the 50-day SMA. This price action suggests that buyers are regaining short-term control. However, since the 50-day SMA remains below the 100-day SMA, the broader trend continues to favor the downside, as highlighted in the latest forecasts.
If WTI manages to close above both the $60.00 psychological threshold and the 100-day SMA, it would reinforce the ongoing rebound and signal strengthening upward momentum. The next resistance level lies at $62.19, which marks the high from January 14.
A decisive move beyond this resistance could indicate a reversal of the prevailing downtrend, potentially paving the way for a further advance toward the $64.00–$66.00 range, an area that previously acted as a supply zone.
On the support side, the 50-day SMA offers immediate backing, with additional support found at the January 8 low of $55.90.
Momentum Indicators
- The Relative Strength Index (RSI) has climbed to around 59, pointing to strengthening bullish momentum while still remaining below overbought territory. This suggests there may be room for further gains if buying pressure continues.
- The Moving Average Convergence Divergence (MACD) indicator is also signaling a positive trend, as the MACD line stays above its signal line and the histogram continues to show positive values.
Disclaimer: The content of this article solely reflects the author's opinion and does not represent the platform in any capacity. This article is not intended to serve as a reference for making investment decisions.
You may also like
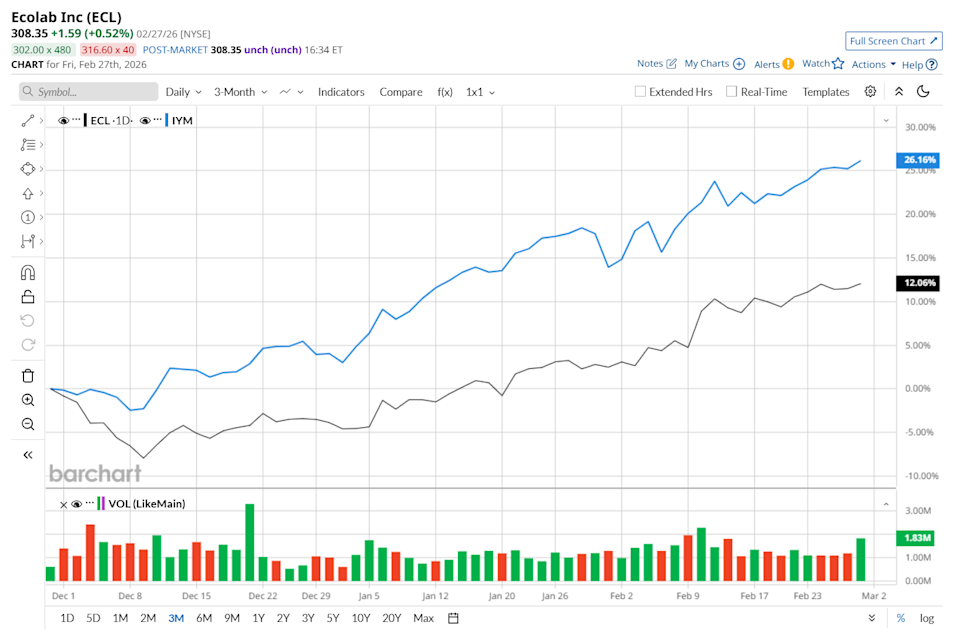
How Does Ecolab's Stock Performance Stack Up Against Other Companies in the Basic Materials Sector?
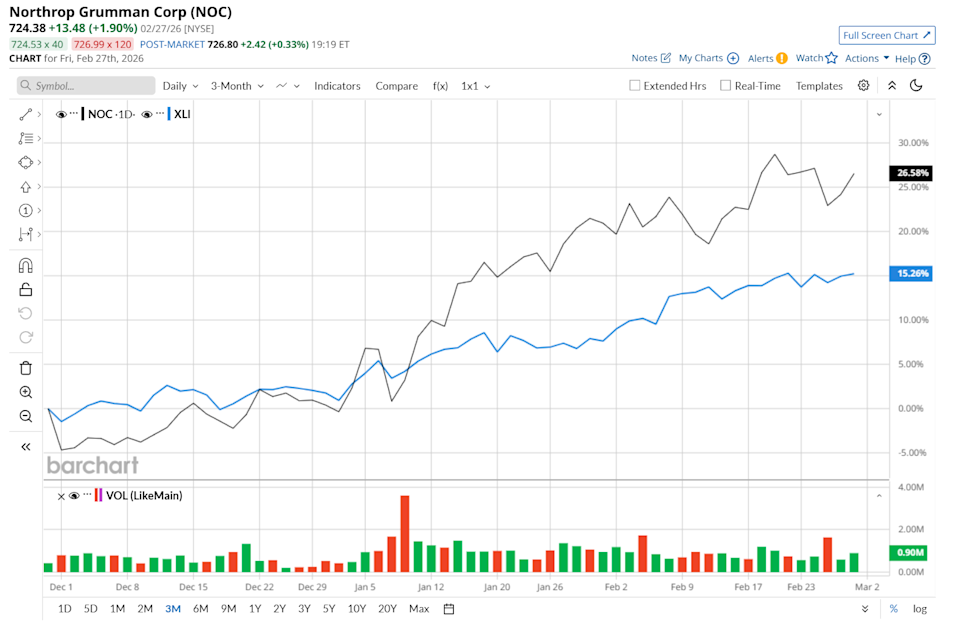
Northrop Grumman Shares: Is NOC Surpassing the Performance of the Industrial Sector?
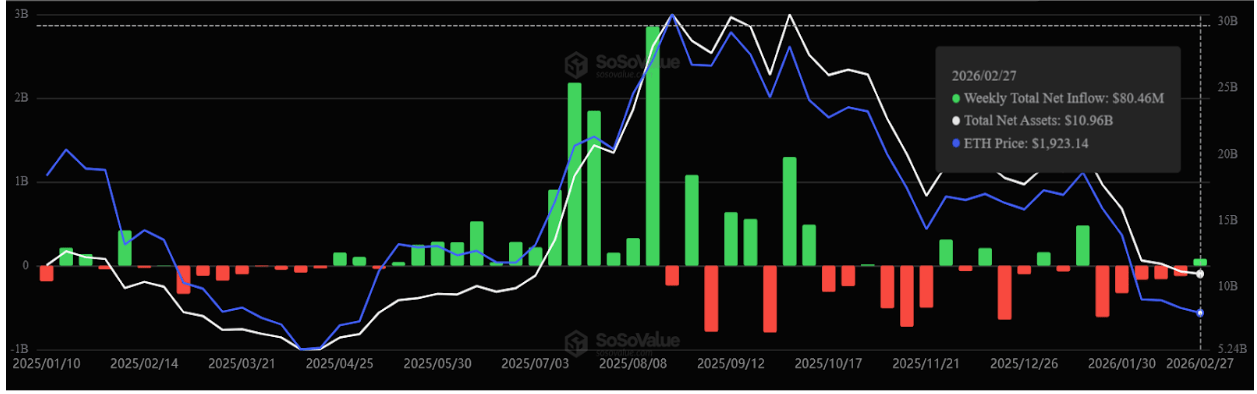
Spot Bitcoin ETFs Record $787 Million Inflows, End 5-Weeks Of Consecutive Outlows
Analyst Says 99% of XRP Investors Will Lose Everything. Here’s why