
After a Record-Breaking Auction, Are U.S. Treasuries Backing Gold or Undermining It?

FX678, January 22 — The market's core driving forces have shifted from the previous day's shock caused by sudden “tariff comments” back to the assessment of macroeconomic data and central bank policy paths. In addition, the policy moves of the Bank of Japan cannot be ignored, as any unexpectedly hawkish statements could trigger a chain reaction across global bond and currency markets.
On Thursday (January 22), after experiencing sharp volatility in the previous trading session, the market’s core drivers shifted back from the shock of the sudden “tariff comments” to an evaluation of macroeconomic data and central bank policy trajectories. The US Treasury market showed a distinct “bullish flattening” trend, with long-term yields falling significantly from their highs; the US Dollar Index, after a brief rebound, returned to oscillate near flat; spot gold came under pressure, entering a high-level consolidation phase after reaching a historic high, as risk sentiment temporarily stabilized. Over the next two to three trading days, the market’s focus will be on a series of upcoming key US economic data releases, especially the Federal Reserve’s preferred inflation gauge — personal consumption expenditures (PCE) data. Its performance will directly impact market expectations for the interest rate path, which in turn will transmit to US dollar-denominated assets and the short-term trend of haven assets.
US Treasuries: Haven Demand and Strong Auctions Drive “Bullish Flattening”; Yield Range Expected to Shift Lower
Recently, the core factors driving US Treasury market volatility have expanded from simply economic data to include global haven demand triggered by geopolitical risks and fiscal concerns in major economies. On Wednesday, as tensions around the Greenland issue showed signs of easing, market risk aversion receded somewhat, but this did not fully reverse the rebound in US Treasuries. A key driver came from robust demand in the Treasury auction market. The $13 billion 20-year Treasury auction held on Wednesday was exceptionally strong, with the final yield (4.846%) one basis point lower than the pre-auction market yield (i.e., a "stop-through"), indicating strong allocation demand from end investors (indirect and direct bidders). Their combined allocation ratio reached as high as 93.8%, the highest since June 2024, while the dealer allocation ratio was compressed to a low of 6.2%. The bid-to-cover ratio reached 2.86, far above the recent average. This clearly demonstrates that in a global environment of uncertainty, the long-term asset attributes of US Treasuries remain attractive to international capital, effectively hedging against selling pressure that could arise from short-term improvements in risk sentiment.
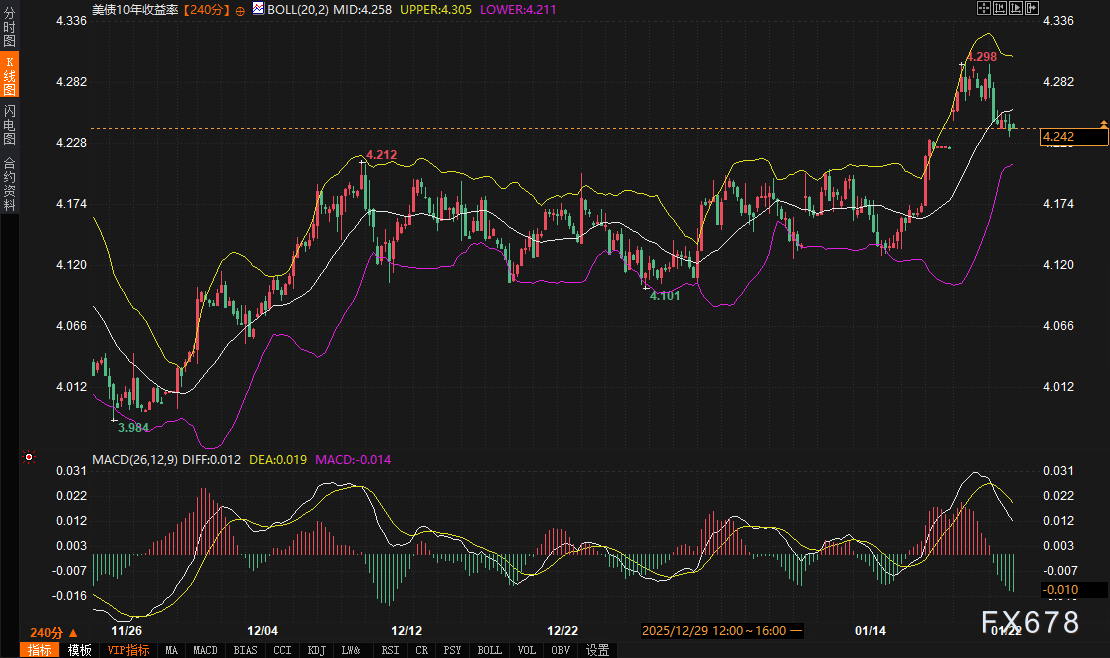
From a technical perspective, the 10-year US Treasury yield surged to a high of 4.301% on the 240-minute candlestick chart on January 21, but quickly retreated and, aided by a strong auction, touched a local low of 4.247%, finally closing at 4.257%. Currently, the yield is hovering near the middle band of the Bollinger Bands (20,2) at 4.258, with the upper and lower bands at 4.305 and 4.211, respectively. The MACD indicator remains below the zero axis, but the DIFF line shows signs of crossing above the DEA line to form a golden cross, and the green bars have shortened, indicating a weakening of short-term downward momentum. Market analysis suggests a tactically neutral stance, trading both ways within the new range, but if yields rebound to the 4.35% area, it would be a good buying opportunity. Considering both fundamentals and technicals, it is expected that in the next 2-3 trading days, the core fluctuation range of the 10-year US Treasury yield will shift lower to 4.28%-4.24%. If the PCE data is moderate, yields may test the lower end of the range or even lower; conversely, if the data is unexpectedly strong, the yield could test resistance near 4.30%. During the session, close attention should be paid to Thursday's upcoming initial jobless claims, the revised Q3 GDP, PCE data, and the results of the 10-year TIPS auction being held on the same day.
US Dollar Index: Geopolitical Risk Premium Fades, Back to Data and Rate Differential Drivers
The short-term movement of the US Dollar Index is closely linked to the US Treasury market, with its logic primarily flowing through the chain of “risk aversion — US Treasury demand — dollar liquidity.” The market turmoil previously triggered by “tariff comments” once gave rise to the so-called “sell America” trade narrative, with concerns that European capital might withdraw from US dollar assets. However, several market strategists have pointed out that there is no concrete evidence of systematic capital outflows. Recent volatility has been more about increased risk management and hedging activity, a normal rebound from the extremely low volatility environment at the end of last year. As geopolitical tensions ease, the dollar’s pricing logic quickly returns to its traditional drivers: the growth differentials and monetary policy expectations between the US and other major economies.
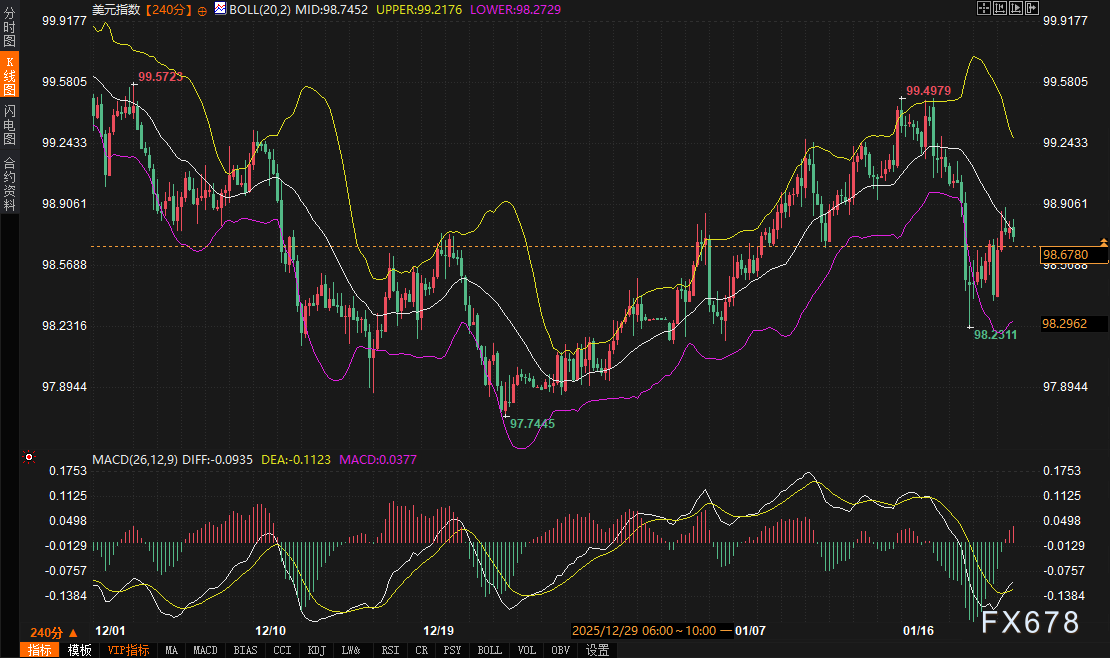
From a market perspective, the US Dollar Index returned to calm after a brief rebound. The 240-minute chart shows the index trading around 98.75, slightly above the middle Bollinger Band at 98.7453. The MACD indicator is below the zero axis, with the DIFF and DEA lines intertwined, indicating a temporary balance of buying and selling forces. The key resistance above is at the previous high near 99.5723, while support below can be referenced at the recent low of 98.2311. Market views suggest that, from a European perspective, it is still too soon to celebrate easing tensions, as the specific agreement framework for the Greenland issue is not yet clear. The market is likely to refocus on central bank policy and rate differentials after a brief period of volatility.
Looking ahead to the next few days, the dollar’s trend will be more directly influenced by US economic data, especially inflation data. If the PCE data reinforces expectations that the Fed will keep rates higher for longer, it may support the dollar. Conversely, if the data points to persistently easing inflation, the relative advantage of the dollar may be weakened. The US Dollar Index is expected to oscillate in the 98.20 - 99.00 range over the next 2-3 days. If it breaks below 98.20, it could fall further; if it breaks above 99.00, it may move up to test the 99.30-99.50 area. In addition to PCE data, attention should also be paid to developments in the eurozone and Japan, especially potential hawkish signals from the Bank of Japan policy meeting, which could have a direct impact on the USD/JPY exchange rate and thus affect the Dollar Index.
Spot Gold: Consolidating Near Historic Highs, Haven Demand Still Intact
Gold hit a historic high of $4,887.82 per ounce on Wednesday before pulling back on Thursday. This retreat was primarily driven by two short-term factors: first, a rebound in risk assets diverted some haven demand; second, a slight recovery in the dollar exerted technical pressure on dollar-denominated gold. However, this has not changed the strong upward trend that began at the end of November last year. The core drivers of this rally are the ongoing global geopolitical tensions (including the Russia-Ukraine situation) and market concerns about the independence of major central banks, particularly the Federal Reserve. These structural factors provide solid haven support for gold.
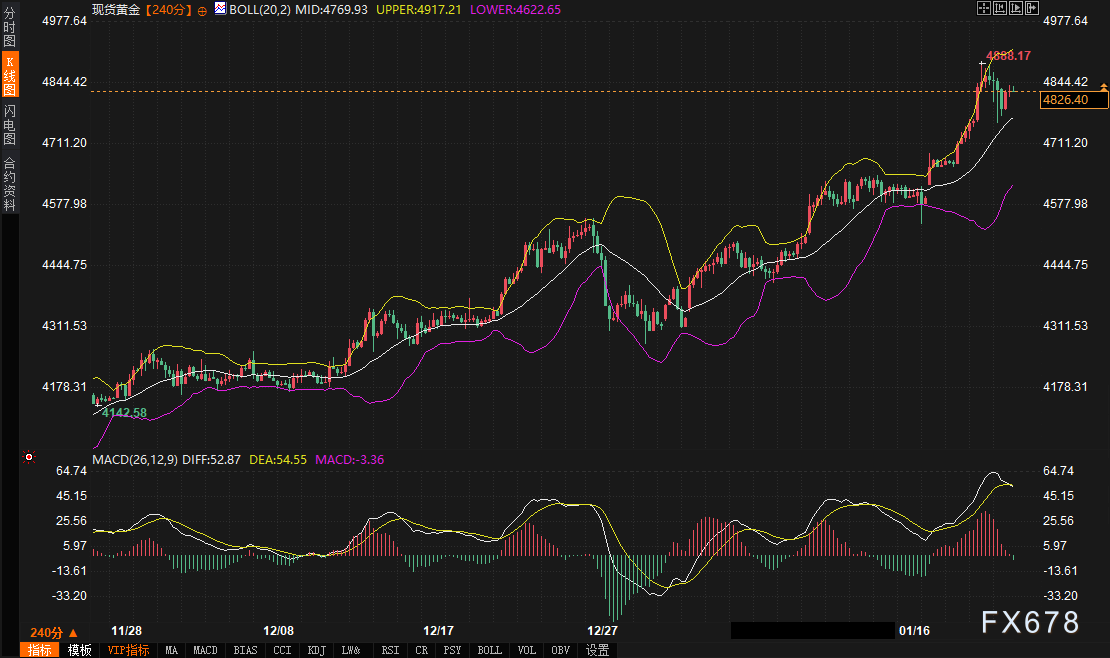
Technical analysis shows that spot gold, on the 240-minute candlestick chart, started its rally from around $4,178 and has now climbed above $4,800. The current price is near $4,825, with a recent high of $4,888.17. Gold continues to trade above the middle Bollinger Band (4,769.89), indicating an overall bullish trend. In the MACD indicator, the DIFF and DEA lines are running high above the zero axis; although there was a brief green bar, it has recently turned red and expanded, suggesting that bullish momentum may be rebuilding. Multiple technical support levels, such as the Bollinger Band middle line and previous consolidation platforms, form buffers for gold prices on pullbacks.
Professional institutions’ views also confirm the market’s optimism. Some analysts point out that gold’s overall upward trend remains intact, with short-term targets possibly reaching the $5,000 to $5,200 area. This reflects the market’s long-term confidence in gold as the ultimate haven asset and a tool to hedge future uncertainty. Over the next 2-3 days, gold is expected to consolidate at elevated levels to digest recent sharp gains. The key technical support zone is at $4,780 - $4,750 (Bollinger Band middle line and previous platform); if this area holds, gold may once again challenge historical highs or even higher. Initial resistance is at $4,880-4,900, with stronger resistance at the upper Bollinger Band near $4,917. During the session, particular attention should be paid to the impact of US PCE data on real interest rate expectations. Any signal reinforcing a “higher for longer” rate stance may temporarily suppress gold, while weak data could quickly spark new buying. At the same time, any new developments in geopolitics should be watched closely, as these remain key variables triggering haven demand for gold.
Outlook for Future Trends
In summary, over the next two to three trading days, the market will be in a transition period from event-driven to data-driven observation. The trend of US Treasury yields will be a key pivot, directly related to the attractiveness of US dollar assets and the temperature of global risk aversion. Strong Treasury auction demand provides phased support for Treasuries, but whether yields can fall further will depend on economic data confirming a path of controlled inflation and moderate economic cooling. The Dollar Index is expected to remain in a range-bound pattern, awaiting data for direction. Spot gold, after reaching historic highs, faces technical consolidation needs, but the foundation of its long-term upward trend — geopolitical risk and macro uncertainty — has not disappeared, and any significant pullback could attract medium- and long-term allocation funds.
Thursday’s intensive economic data releases, especially the core PCE inflation data, will be the touchstone determining the market’s short-term direction. If the data meets or falls below expectations, it may reinforce the “bullish flattening” trade, suppress the dollar, and provide upward momentum for gold; if unexpectedly strong, it could briefly reverse risk sentiment, push up US Treasury yields and the dollar, and put pressure on gold prices. In addition, the policy moves of the Bank of Japan cannot be ignored, as any unexpectedly hawkish statements could trigger a chain reaction in global bond and currency markets.
Disclaimer: The content of this article solely reflects the author's opinion and does not represent the platform in any capacity. This article is not intended to serve as a reference for making investment decisions.
You may also like
Barclays' $126 Target Locks in Blackstone’s Redemption Reset—Is the Value Trade Now Priced?
Mitek Systems Experiences Rapid Growth Amid Rising Interest in Small-Cap Tech Stocks
Aptera Motors (SEV) Surges 20.77% on Bullish Technicals and Volatile Options Activity