
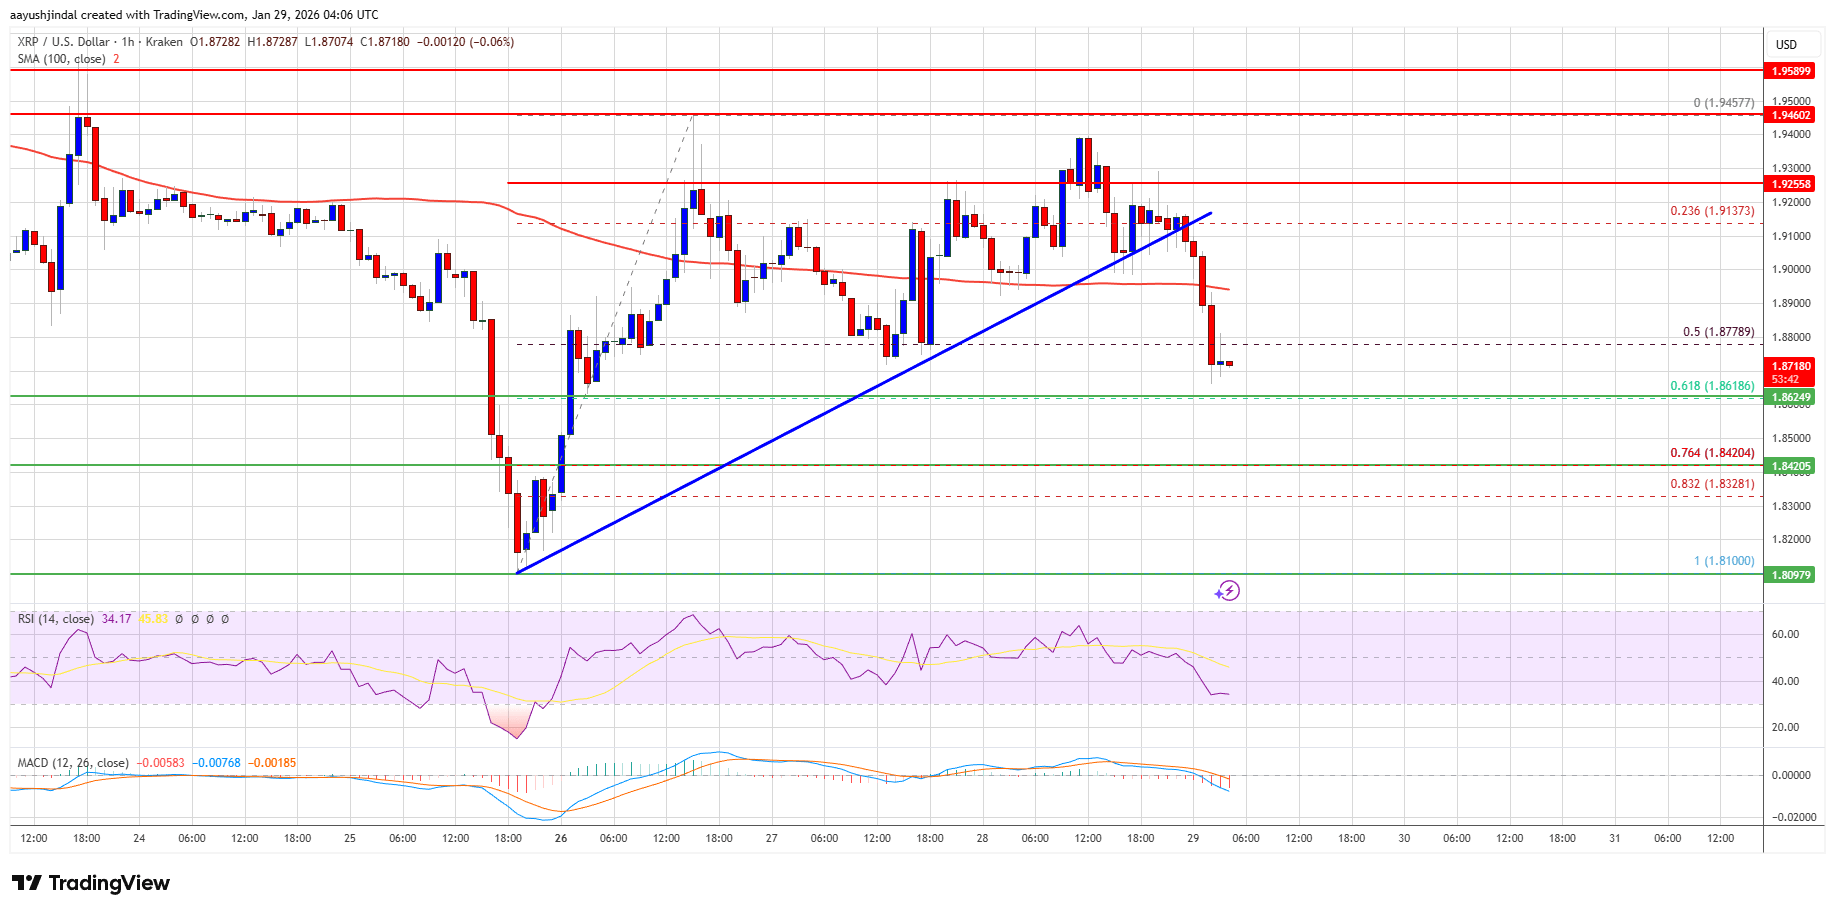
XRP Price Signals Vulnerability With Another Drop On The Table

XRP price failed to surpass $1.950 and started another decline. The price is now correcting gains and might struggle to stay above $1.860.
- XRP price started a downside correction and declined below $1.90.
- The price is now trading below $1.890 and the 100-hourly Simple Moving Average.
- There was a break below a key bullish trend line with support at $1.910 on the hourly chart of the XRP/USD pair (data source from Kraken).
- The pair could start another increase if it stays above $1.860.
XRP Price Dips Further
XRP price failed to clear $1.950 and started a downside correction, like Bitcoin and Ethereum. The price dipped below the $1.90 and $1.880 levels to enter a negative zone.
The price even dipped below the 50% Fib retracement level of the upward move from the $1.810 swing low to the $1.945 high. Besides, there was a break below a key bullish trend line with support at $1.910 on the hourly chart of the XRP/USD pair.
The price is now trading below $1.880 and the 100-hourly Simple Moving Average. If there is a fresh upward move, the price might face resistance near the $1.90 level. The first major resistance is near the $1.9250 level, above which the price could rise and test $1.950.
 Source:
XRPUSD on TradingView.com
Source:
XRPUSD on TradingView.com
A clear move above the $1.950 resistance might send the price toward the $2.00 resistance. Any more gains might send the price toward the $2.00 resistance. The next major hurdle for the bulls might be near $2.050.
More Losses?
If XRP fails to clear the $1.9250 resistance zone, it could start a fresh decline. Initial support on the downside is near the $1.860 level and the 61.8% Fib retracement level of the upward move from the $1.810 swing low to the $1.945 high. The next major support is near the $1.8420 level.
If there is a downside break and a close below the $1.8420 level, the price might continue to decline toward $1.820. The next major support sits near the $1.80 zone, below which the price could continue lower toward $1.7650.
Technical Indicators
Hourly MACD – The MACD for XRP/USD is now gaining pace in the bearish zone.
Hourly RSI (Relative Strength Index) – The RSI for XRP/USD is now below the 50 level.
Major Support Levels – $1.860 and $1.8420.
Major Resistance Levels – $1.9250 and $1.950.
Disclaimer: The content of this article solely reflects the author's opinion and does not represent the platform in any capacity. This article is not intended to serve as a reference for making investment decisions.
You may also like
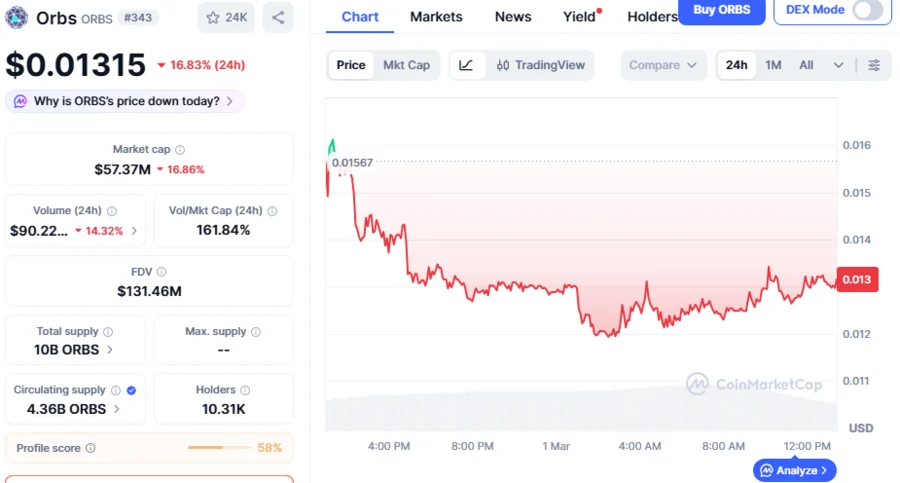
ORBS Price Erupts 36.9% As Analyst Identifies Large Bullish Candle That Sets To Trigger Further Market Rally
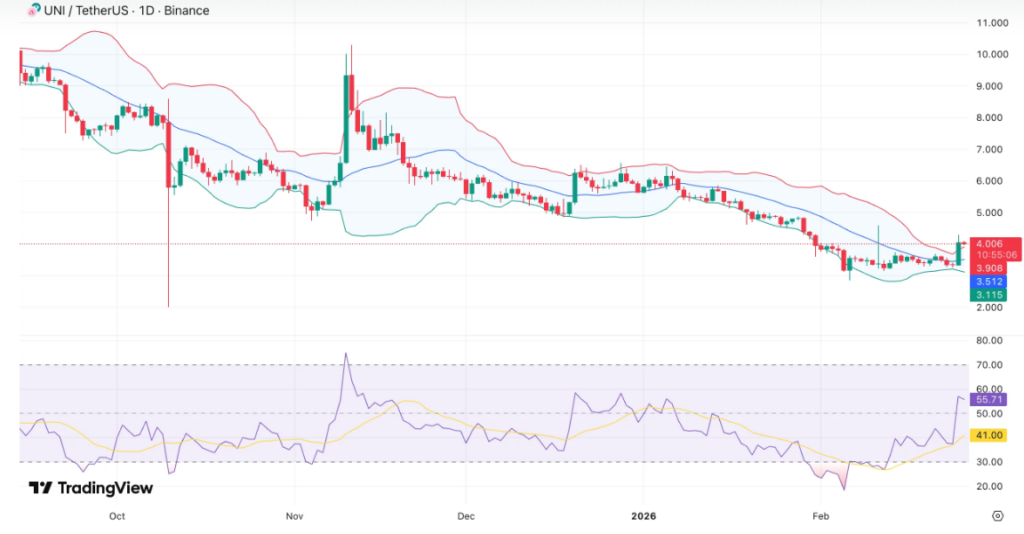
Uniswap Price Eyes $4.60 as Fee Burn Vote Advances
移动游戏、广告营收大增,B站Q3营收同比增长26%,经调净利润首次转正

Trending news
MoreORBS Price Erupts 36.9% As Analyst Identifies Large Bullish Candle That Sets To Trigger Further Market Rally
XRP Price News 2026: Degens Favor DeepSnitch AI as Top Pick for 100X as Power Protocol RSI Hints at Price Correction, Chainalysis Reports 50% Spike in Ransomware Incidents but Ransom Payouts Decline