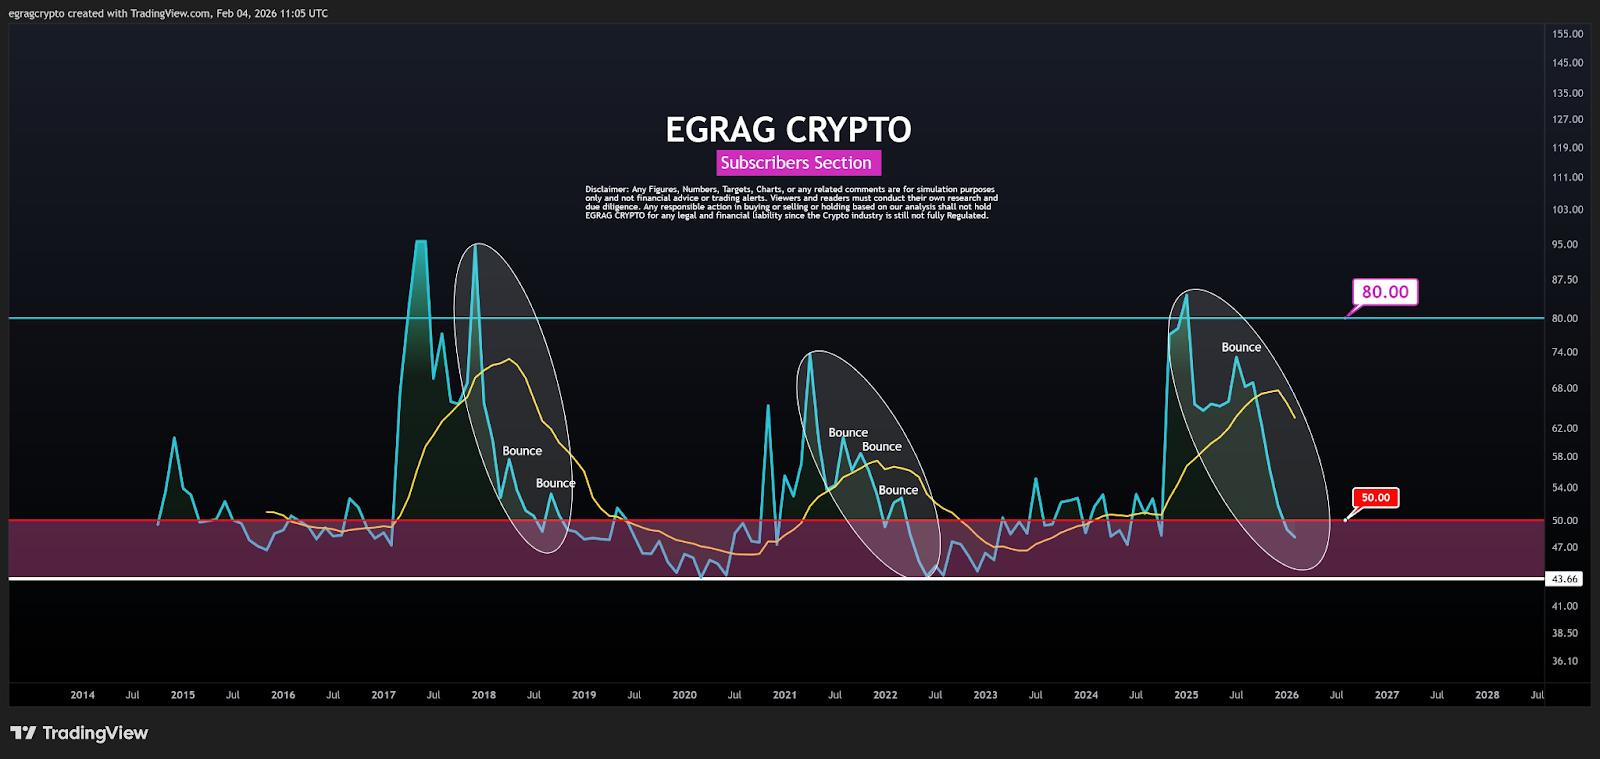
The crypto analyst Egrag Crypto shared his thoughts on X regarding the recent XRP price structure, applying principles from Elliott Wave theory and analysis of the Relative Strength Index (RSI).
He pointed out several elements, including the sharp RSI drop, saying that while it’s bad for the short term, it’s very good for the long term. Egrag believes the price chart shows the end of a big correction (Wave 2), not a smaller one (Wave 4).
Once Wave 2 ends, Wave 3 typically follows, which is characteristically the most powerful and expansive wave in the Elliott Wave cycle.
Egrag describes the RSI drop as a momentum reset that shakes out impatient sellers, making room for a bigger rally later.
 Source:
X
Source:
X
Recent data shows XRP has been falling and correcting, which matches the negative RSI picture.
The price recently dropped below $1.40, its lowest point in one year, as the overall crypto market fell. This pushed XRP’s RSI very low, a level that sometimes comes before a price rebound.
Other technical signs confirm the current downtrend, as XRP has lost the $2 support level, trading below important trend lines, and is seeing heavy selling, all hallmarks of a bearish market phase.
When the RSI indicator falls steeply during a price drop, it shows that short-term momentum is rather weak. Some chart traders see this kind of extreme low as a potential bottoming signal, where most sellers have given up, which can lead to a bounce. This concept aligns with the Elliott Wave interpretation Egrag pointed out.
At the moment, according to CoinMarketCap, XRP is sitting at a price of around $1.36, which is more than a 14% drop in just the last 24 hours. It has a market cap of $81.79B and a 24-hour volume of $6.9B, an increase of 62.78%.
Related: Ripple is Preparing XRP for the Next Bull Cycle—Canary Capital CEO