
Epam (EPAM) Q4 Earnings: How Key Metrics Compare to Wall Street Estimates

Epam (EPAM) reported $1.41 billion in revenue for the quarter ended December 2025, representing a year-over-year increase of 12.8%. EPS of $3.26 for the same period compares to $2.84 a year ago.
The reported revenue compares to the Zacks Consensus Estimate of $1.39 billion, representing a surprise of +1.08%. The company delivered an EPS surprise of +3.17%, with the consensus EPS estimate being $3.16.
While investors closely watch year-over-year changes in headline numbers -- revenue and earnings -- and how they compare to Wall Street expectations to determine their next course of action, some key metrics always provide a better insight into a company's underlying performance.
Since these metrics play a crucial role in driving the top- and bottom-line numbers, comparing them with the year-ago numbers and what analysts estimated about them helps investors better project a stock's price performance.
Here is how Epam performed in the just reported quarter in terms of the metrics most widely monitored and projected by Wall Street analysts:- Headcount: 62,850 compared to the 62,734 average estimate based on two analysts.
- Delivery professionals: 56,600 versus the two-analyst average estimate of 56,450.
- Revenues by Customer Location- Americas: $810.6 million compared to the $830.55 million average estimate based on two analysts. The reported number represents a change of +7.6% year over year.
- Revenues by Customer Location- APAC: $27.3 million versus $28.19 million estimated by two analysts on average. Compared to the year-ago quarter, this number represents a +0.5% change.
- Revenues by Customer Location- EMEA: $569.6 million versus $525.76 million estimated by two analysts on average. Compared to the year-ago quarter, this number represents a +21.8% change.
- Revenues by Industry Verticals- Financial Services: $336.4 million compared to the $331.55 million average estimate based on two analysts. The reported number represents a change of +19.8% year over year.
- Revenues by Industry Verticals- Software & Hi-Tech: $214.9 million compared to the $202.43 million average estimate based on two analysts. The reported number represents a change of +18.1% year over year.
- Revenues by Industry Verticals- Life Sciences & Healthcare: $155 million versus $166.16 million estimated by two analysts on average. Compared to the year-ago quarter, this number represents a +2% change.
- Revenues by Industry Verticals- Emerging Verticals: $252.2 million versus the two-analyst average estimate of $233.81 million. The reported number represents a year-over-year change of +19.1%.
- Revenues by Industry Verticals- Consumer Goods, Retail & Travelr: $277.9 million versus $276.83 million estimated by two analysts on average. Compared to the year-ago quarter, this number represents a +10.9% change.
- Revenues by Contract Type- Time-and-material: $1.12 billion versus the two-analyst average estimate of $1.16 billion. The reported number represents a year-over-year change of +10.8%.
- Revenues by Contract Type- Fixed-price: $284.9 million compared to the $223.21 million average estimate based on two analysts. The reported number represents a change of +21.9% year over year.
View all Key Company Metrics for Epam here>>>
Shares of Epam have returned -36.5% over the past month versus the Zacks S&P 500 composite's -1% change. The stock currently has a Zacks Rank #3 (Hold), indicating that it could perform in line with the broader market in the near term.Disclaimer: The content of this article solely reflects the author's opinion and does not represent the platform in any capacity. This article is not intended to serve as a reference for making investment decisions.
You may also like
Corporate Power Reshapes Bitcoin’s Decentralized Legacy
Eaton Advances to 191st Place in Trading Volume Driven by Strong Earnings and Robust Growth Plan
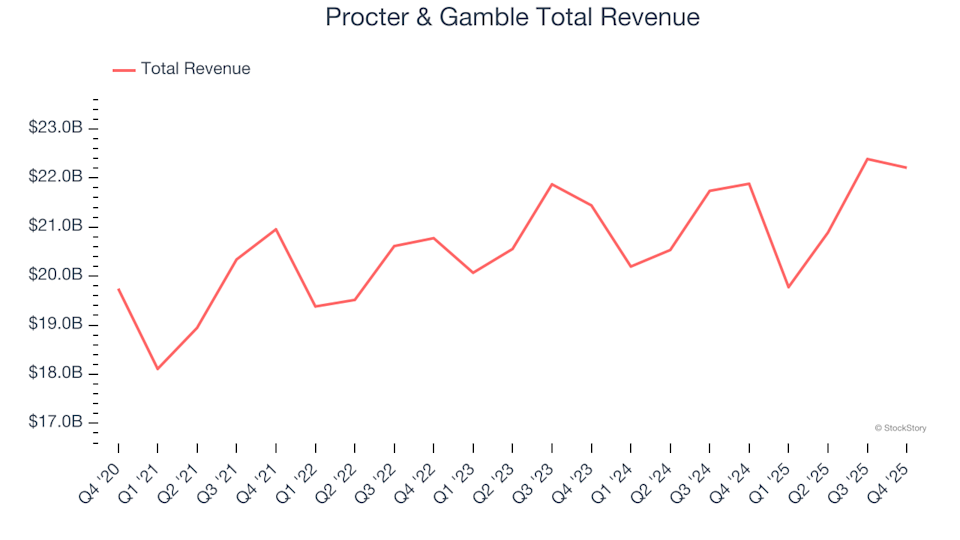
Q4 Financial Overview: Comparing Procter & Gamble (NYSE:PG) With Other Household Product Companies
Great Elm Capital: Fourth Quarter Earnings Overview