
Is First Trust NASDAQ-100 Ex-Technology Sector ETF (QQXT) Currently a Top ETF Choice?

Overview of the First Trust NASDAQ-100 Ex-Technology Sector ETF (QQXT)
Launched on February 8, 2007, the First Trust NASDAQ-100 Ex-Technology Sector ETF (QQXT) is a smart beta ETF that targets the large-cap growth segment of the market.
Understanding Smart Beta ETFs
Traditionally, the ETF market has been dominated by funds that follow market capitalization-weighted indexes, which are designed to mirror the performance of a particular market segment or the overall market.
For investors who trust in the efficiency of the market, market cap-weighted indexes offer a straightforward, cost-effective, and transparent way to match market returns.
However, some investors believe that it is possible to outperform the market through strategic stock selection. These investors may choose funds that follow alternative indexing methods, commonly referred to as smart beta strategies.
Smart beta indexes select stocks based on specific fundamental factors or a combination of characteristics, aiming to enhance risk-adjusted returns. Approaches such as equal weighting, fundamental weighting, and volatility or momentum-based weighting are available, though not all guarantee outperformance.
About the Fund and Its Index
First Trust Advisors manages QQXT, which has accumulated over $204.76 million in assets, positioning it as an average-sized fund within the large-cap growth category. The ETF aims to replicate the performance of the NASDAQ-100 Ex-Tech Sector Index, before fees and expenses.
This index is constructed by equally weighting the non-technology stocks within the NASDAQ-100 Index, making it a subset of that broader index. The NASDAQ-100 itself includes 100 of the largest non-financial companies, both domestic and international, listed on NASDAQ by market capitalization.
Fees and Expenses
When choosing an ETF, cost is a key consideration, as lower expenses can lead to better long-term returns if all other factors are equal.
QQXT charges an annual operating expense of 0.60%, placing it on the higher end of the cost spectrum among its peers. The fund’s trailing 12-month dividend yield stands at 1.17%.
Sector Allocation and Major Holdings
While ETFs generally provide diversified exposure to reduce the impact of individual stock risk, it’s important to review the fund’s actual holdings. Most ETFs, including QQXT, disclose their portfolios daily for transparency.
QQXT’s largest sector allocation is Industrials, which makes up about 19.1% of the portfolio. Healthcare and Consumer Staples are also significant contributors.
Among individual stocks, Baker Hughes Company (Class A) represents roughly 2.29% of assets, followed by Old Dominion Freight Line, Inc. and Gilead Sciences, Inc. The top ten holdings collectively account for approximately 20.9% of the fund’s assets.
Performance and Risk Profile
Year-to-date, QQXT has returned about 3.23%, and over the past year (as of February 25, 2026), it has gained around 5.36%. During the last 52 weeks, the fund’s price ranged from $84.34 to $102.58.
With a beta of 0.90 and a three-year standard deviation of 13.50%, QQXT is considered a moderate risk option in its category. The fund holds approximately 57 stocks, providing broad diversification and reducing company-specific risk.
Other ETF Choices
QQXT is a solid pick for those aiming to outperform the large-cap growth segment, but there are alternative ETFs to consider. Vanguard Growth ETF (VUG) tracks the CRSP U.S. Large Cap Growth Index, while Invesco QQQ follows the NASDAQ-100 Index. VUG manages $195.99 billion in assets with a 0.03% expense ratio, and QQQ holds $399.8 billion with a 0.20% expense ratio.
Investors seeking lower costs and reduced risk might prefer traditional market cap-weighted ETFs that aim to match the returns of the large-cap growth sector.
Conclusion
To further explore QQXT and other ETF options, use screening tools to find funds that align with your investment goals and stay updated with the latest ETF news and analysis.
Disclaimer: The content of this article solely reflects the author's opinion and does not represent the platform in any capacity. This article is not intended to serve as a reference for making investment decisions.
You may also like
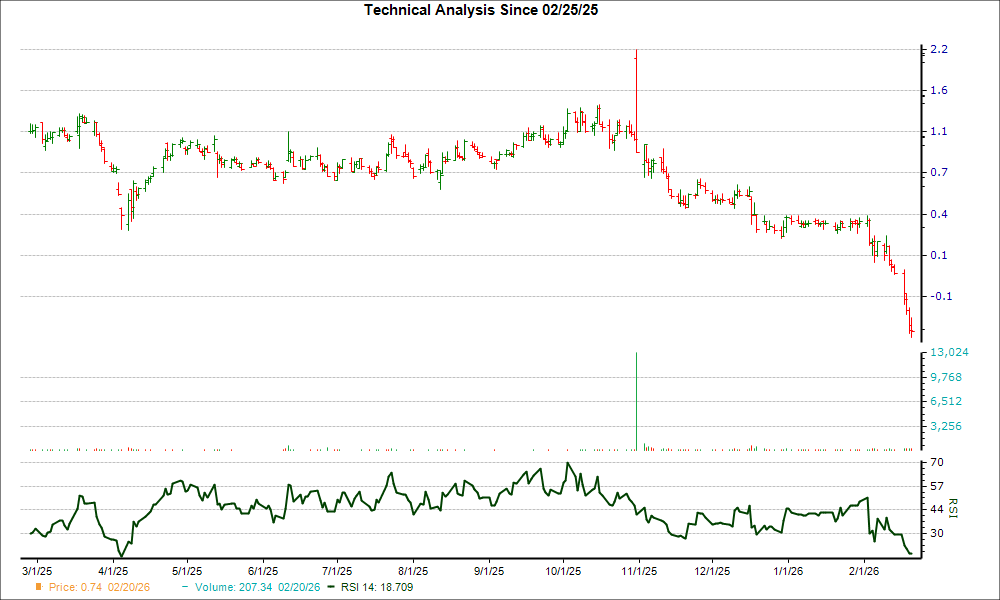
Down 46.9% Over the Past Month, Here’s Why Getty Images Holdings, Inc. (GETY) May Be Poised for a Rebound
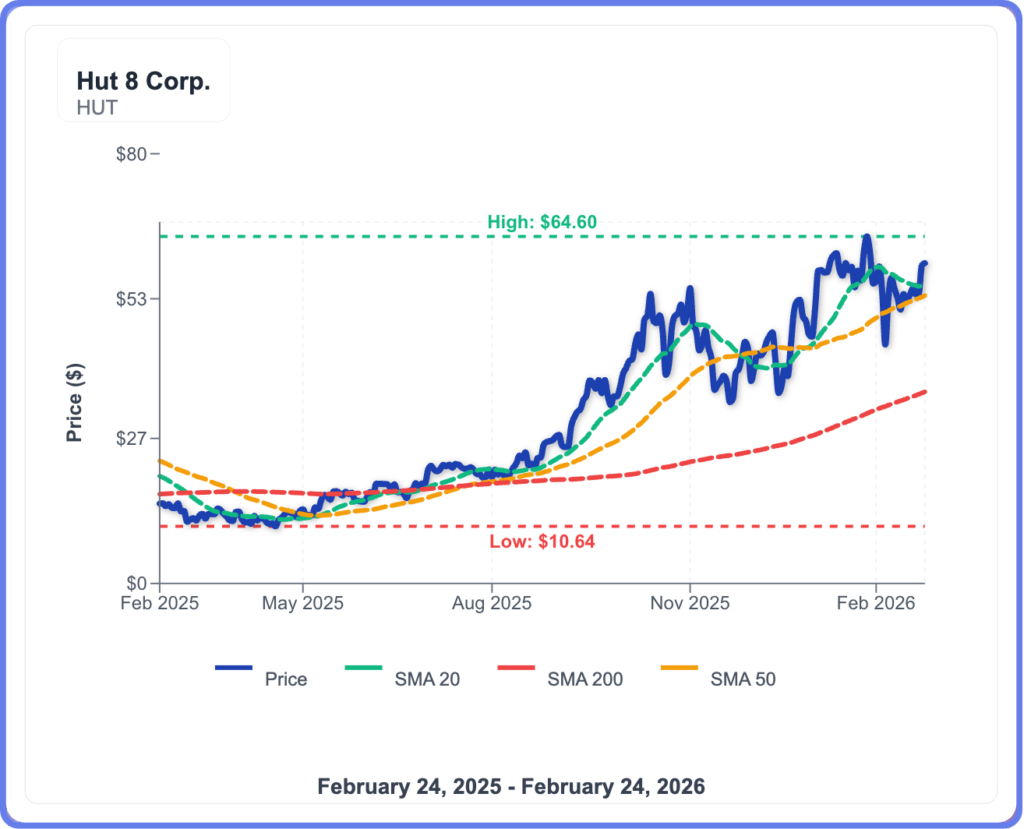
Hut 8 Stock Pops As Earnings Highlight AI Pivot
Comcast (CMCSA) Faces Downgrade from BNP Paribas as Fiber Headwinds Grow

Why Is Lumen Technologies Stock Gaining Wednesday?