
Liquidia Shares Fall 10.5%: Unpacking the Reasons for the Steep Decline

LQDA Faces Steep Decline Amid Technical Pressure
Key Points
- LQDA dropped sharply to $29.20, marking a 10.5% fall from its intraday peak of $33.97.
- Trading volume soared to 2.75 million shares, representing 3.9% of the float.
- Technical indicators highlight weakness: RSI at 17.51 signals oversold conditions, and MACD at -1.29 confirms negative momentum.
- Sector peers such as JNJ (-0.55%) saw only minor declines.
Technical Breakdown Drives Liquidia Lower
Liquidia’s shares have tumbled to a new 52-week low of $29.20, with no positive news to offset the negative technical setup. The stock’s rapid decline was fueled by significant volatility and a decisive break below key support levels, leaving investors searching for explanations. While the pharmaceutical sector shows mixed signals and leveraged ETFs like PILL have gained 1.8%, Liquidia’s move raises concerns about short-term positioning and risk management.
Bearish Momentum Intensifies
The 10.5% drop in LQDA is primarily the result of technical selling rather than any fresh news. The stock opened at $33.87, gapped lower, and failed to reclaim its 200-day moving average at $25.74. A bearish candlestick pattern, including a bearish engulfing candle, points to capitulation. With the RSI at 17.51 and a negative MACD histogram (-1.196), technicals confirm the oversold state. The price is hovering near the lower Bollinger Band ($31.12), signaling exhaustion. The absence of buyers at crucial levels has intensified the selloff.
Pharmaceutical Sector Remains Mixed
The broader pharmaceutical sector is showing divergent trends. Johnson & Johnson slipped 0.55% even as the S&P 500 advanced by 1.2%. Leveraged ETFs such as PILL (+1.8%) and XPH (+0.5%) displayed some resilience, but Liquidia’s sharp drop underscores the sector’s volatility. While JNJ’s weakness reflects broader market shifts, Liquidia’s decline is more closely tied to technical factors than to sector-wide trends.
Bearish Strategies: ETFs and Put Options to Consider
- PJP ($109.87, +0.31%) and XPH ($58.32, +0.50%) show some sector strength.
- PILL ($13.32, +1.83%) offers triple leverage for aggressive short-term trades.
- Key technical levels: 200-day MA at $25.74, RSI at 17.51 (oversold), MACD at -1.29 (bearish), lower Bollinger Band at $31.12.
Liquidia’s technical outlook suggests the downtrend could persist. Support at $31.12 (Bollinger Band) and $25.74 (200-day MA) are crucial. The 30-day RSI at 17.51 hints at a possible rebound, but with bearish momentum indicators like MACD and a negative histogram, further declines are likely. Leveraged ETFs such as PILL may offer amplified returns for those betting on continued weakness.
Top Put Options for Bearish Traders
-
LQDA20260306P28.5 (Put, $28.5 strike, expires Mar 6):
- Implied Volatility: 21.06% (moderate)
- Leverage: 6148% (very high)
- Delta: -0.132 (moderate sensitivity)
- Theta: -0.0016 (minimal time decay)
- Gamma: 0.0317 (high sensitivity)
- Turnover: 217
- Best suited for a 5% downside move to $28.54; payoff at strike equals projected price ($0.00).
-
LQDA20260306P29.5 (Put, $29.5 strike, expires Mar 6):
- Implied Volatility: 181.84% (extreme)
- Leverage: 10.25% (moderate)
- Delta: -0.386 (aggressive sensitivity)
- Theta: -0.1169 (significant time decay)
- Gamma: 0.0413 (high sensitivity)
- Turnover: 300
- High gamma and moderate delta make it suitable for a 5% downside; payoff is $0.96 (strike above projected price).
Suggested Moves: Traders with a bearish outlook may consider the LQDA20260306P29.5 put if the stock falls below $29.20. For broader sector exposure, PILL provides leveraged access to pharmaceutical trends.
Historical Performance After Major Drops
Reviewing past performance, LQDA has historically shown positive returns following an 11% single-day drop. Backtesting reveals a 3-day win rate of 52.44%, a 10-day win rate of 57.72%, and a 30-day win rate of 60.98%. The highest return during the test period was 17.24%, achieved on day 59.
Critical Levels to Watch: $25.74 and Sector Rotation
Unless Liquidia rebounds above $31.12 (lower Bollinger Band) or $25.74 (200-day moving average), the decline is likely to continue. Oversold technicals and negative momentum indicators point to further downside risk. Investors should closely monitor the 200-day MA as a key support and keep an eye on sector rotation, especially through PILL. With JNJ underperforming, sector-wide risks persist. Actionable idea: Short-term bears may target LQDA20260306P29.5 if the stock breaks below $29.20, while ETFs like PILL offer leveraged exposure to sector moves.
Disclaimer: The content of this article solely reflects the author's opinion and does not represent the platform in any capacity. This article is not intended to serve as a reference for making investment decisions.
You may also like
Planet Labs Stock Plummets 4.02% Despite $151B Defense Contract Ranks 493rd in Trading Volume
QSR Shares See Modest Rise Following Strategic Shift and Analyst Upgrades, Even as Trading Volume Ranks 463rd
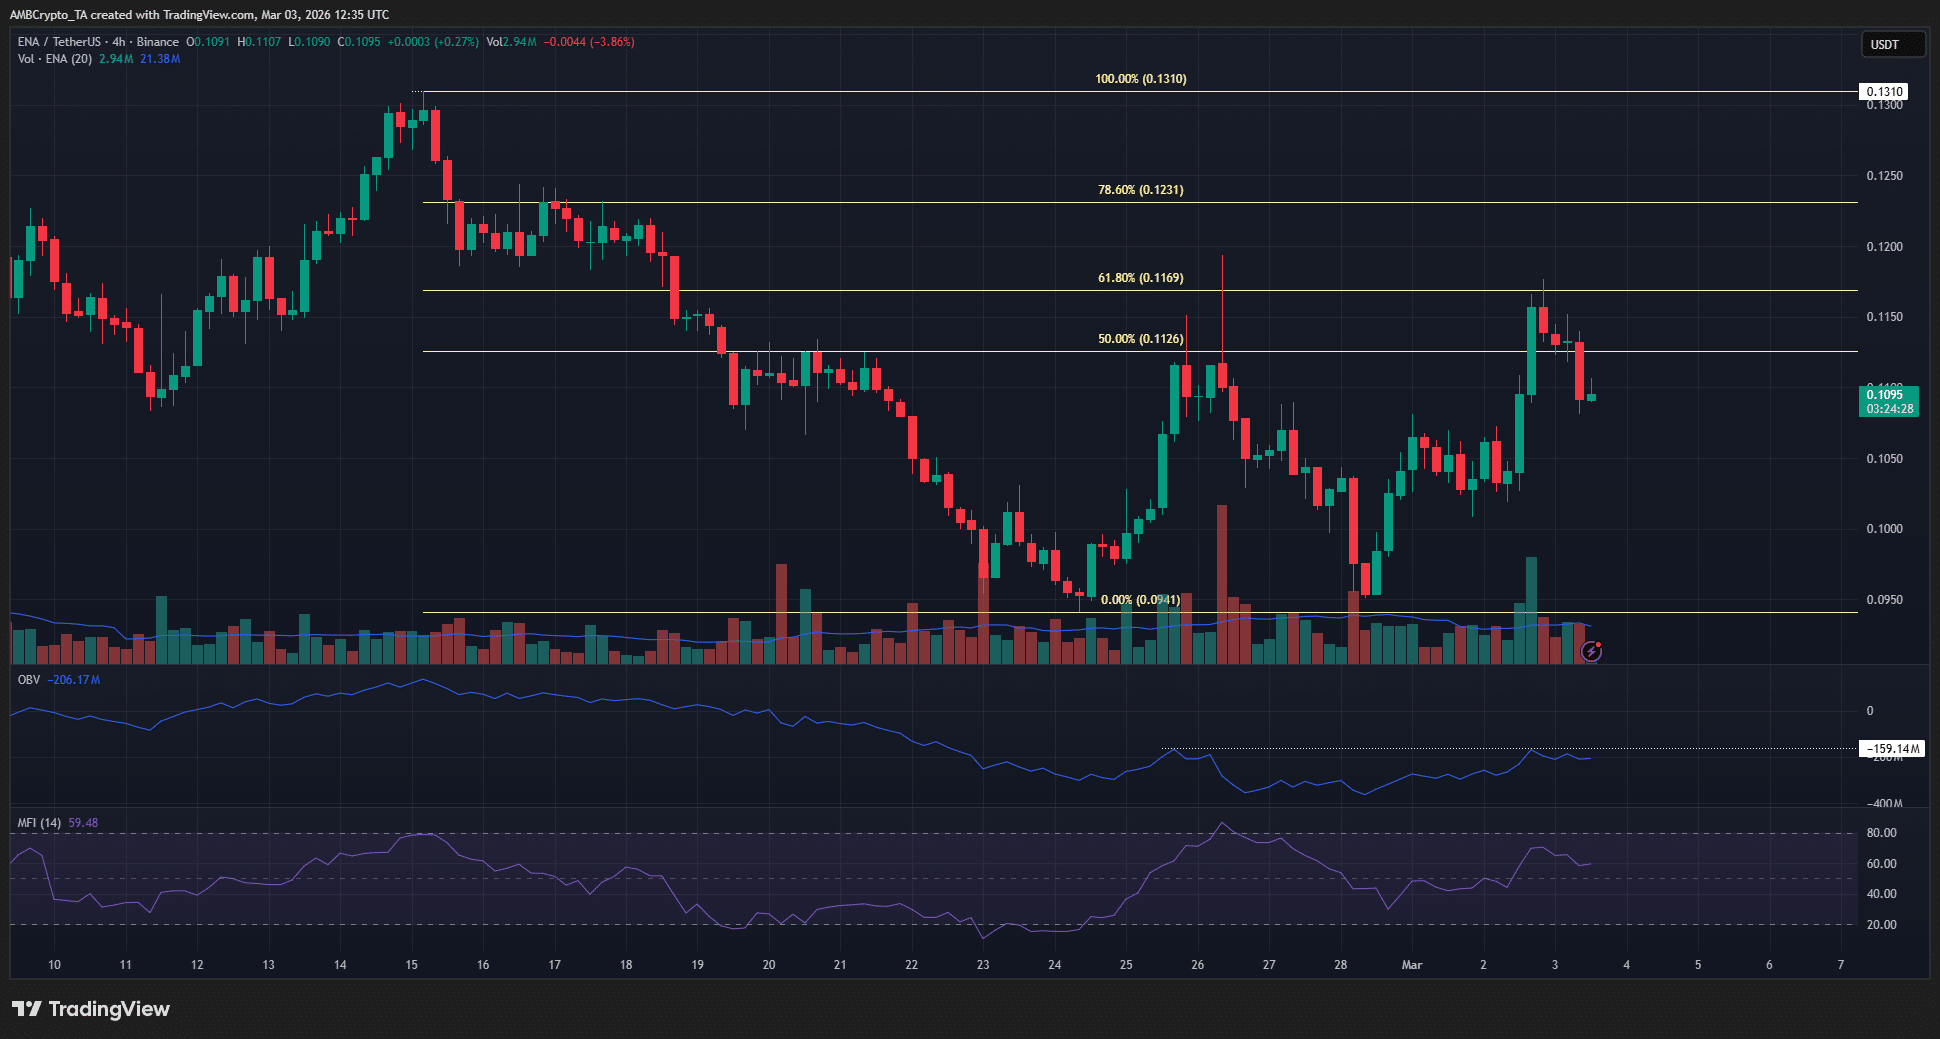
Ethena’s retracement rally, explained: Heavy volume, light conviction
DTE Energy Experiences 56% Jump in Volume, Moving Its Stock to 490th Place in Daily Trading Rankings