u.today
On Feb. 25, 2026, $XRP climbed 6% in a single day, closing at $1.44 on Binance, according to TradingView, after opening near $1.35.
This increase followed a rough start to the year. $XRP had already dropped 10.6% in January and an additional 13.8% in the first part of February. This significant daily increase is notable because it occurred when key technical indicators turned positive.
Where does $1.50 for $XRP prediction come from?
Look at the daily chart, where the Bollinger Bands — a widely used tool that measures price volatility — now show the upper band at $1.51. The middle band is at $1.42, and the lower band is at $1.34. The price of $XRP closed near the middle band and is pushing higher. If the buying continues, this setup is a clear sign that $1.50 is the next realistic target.
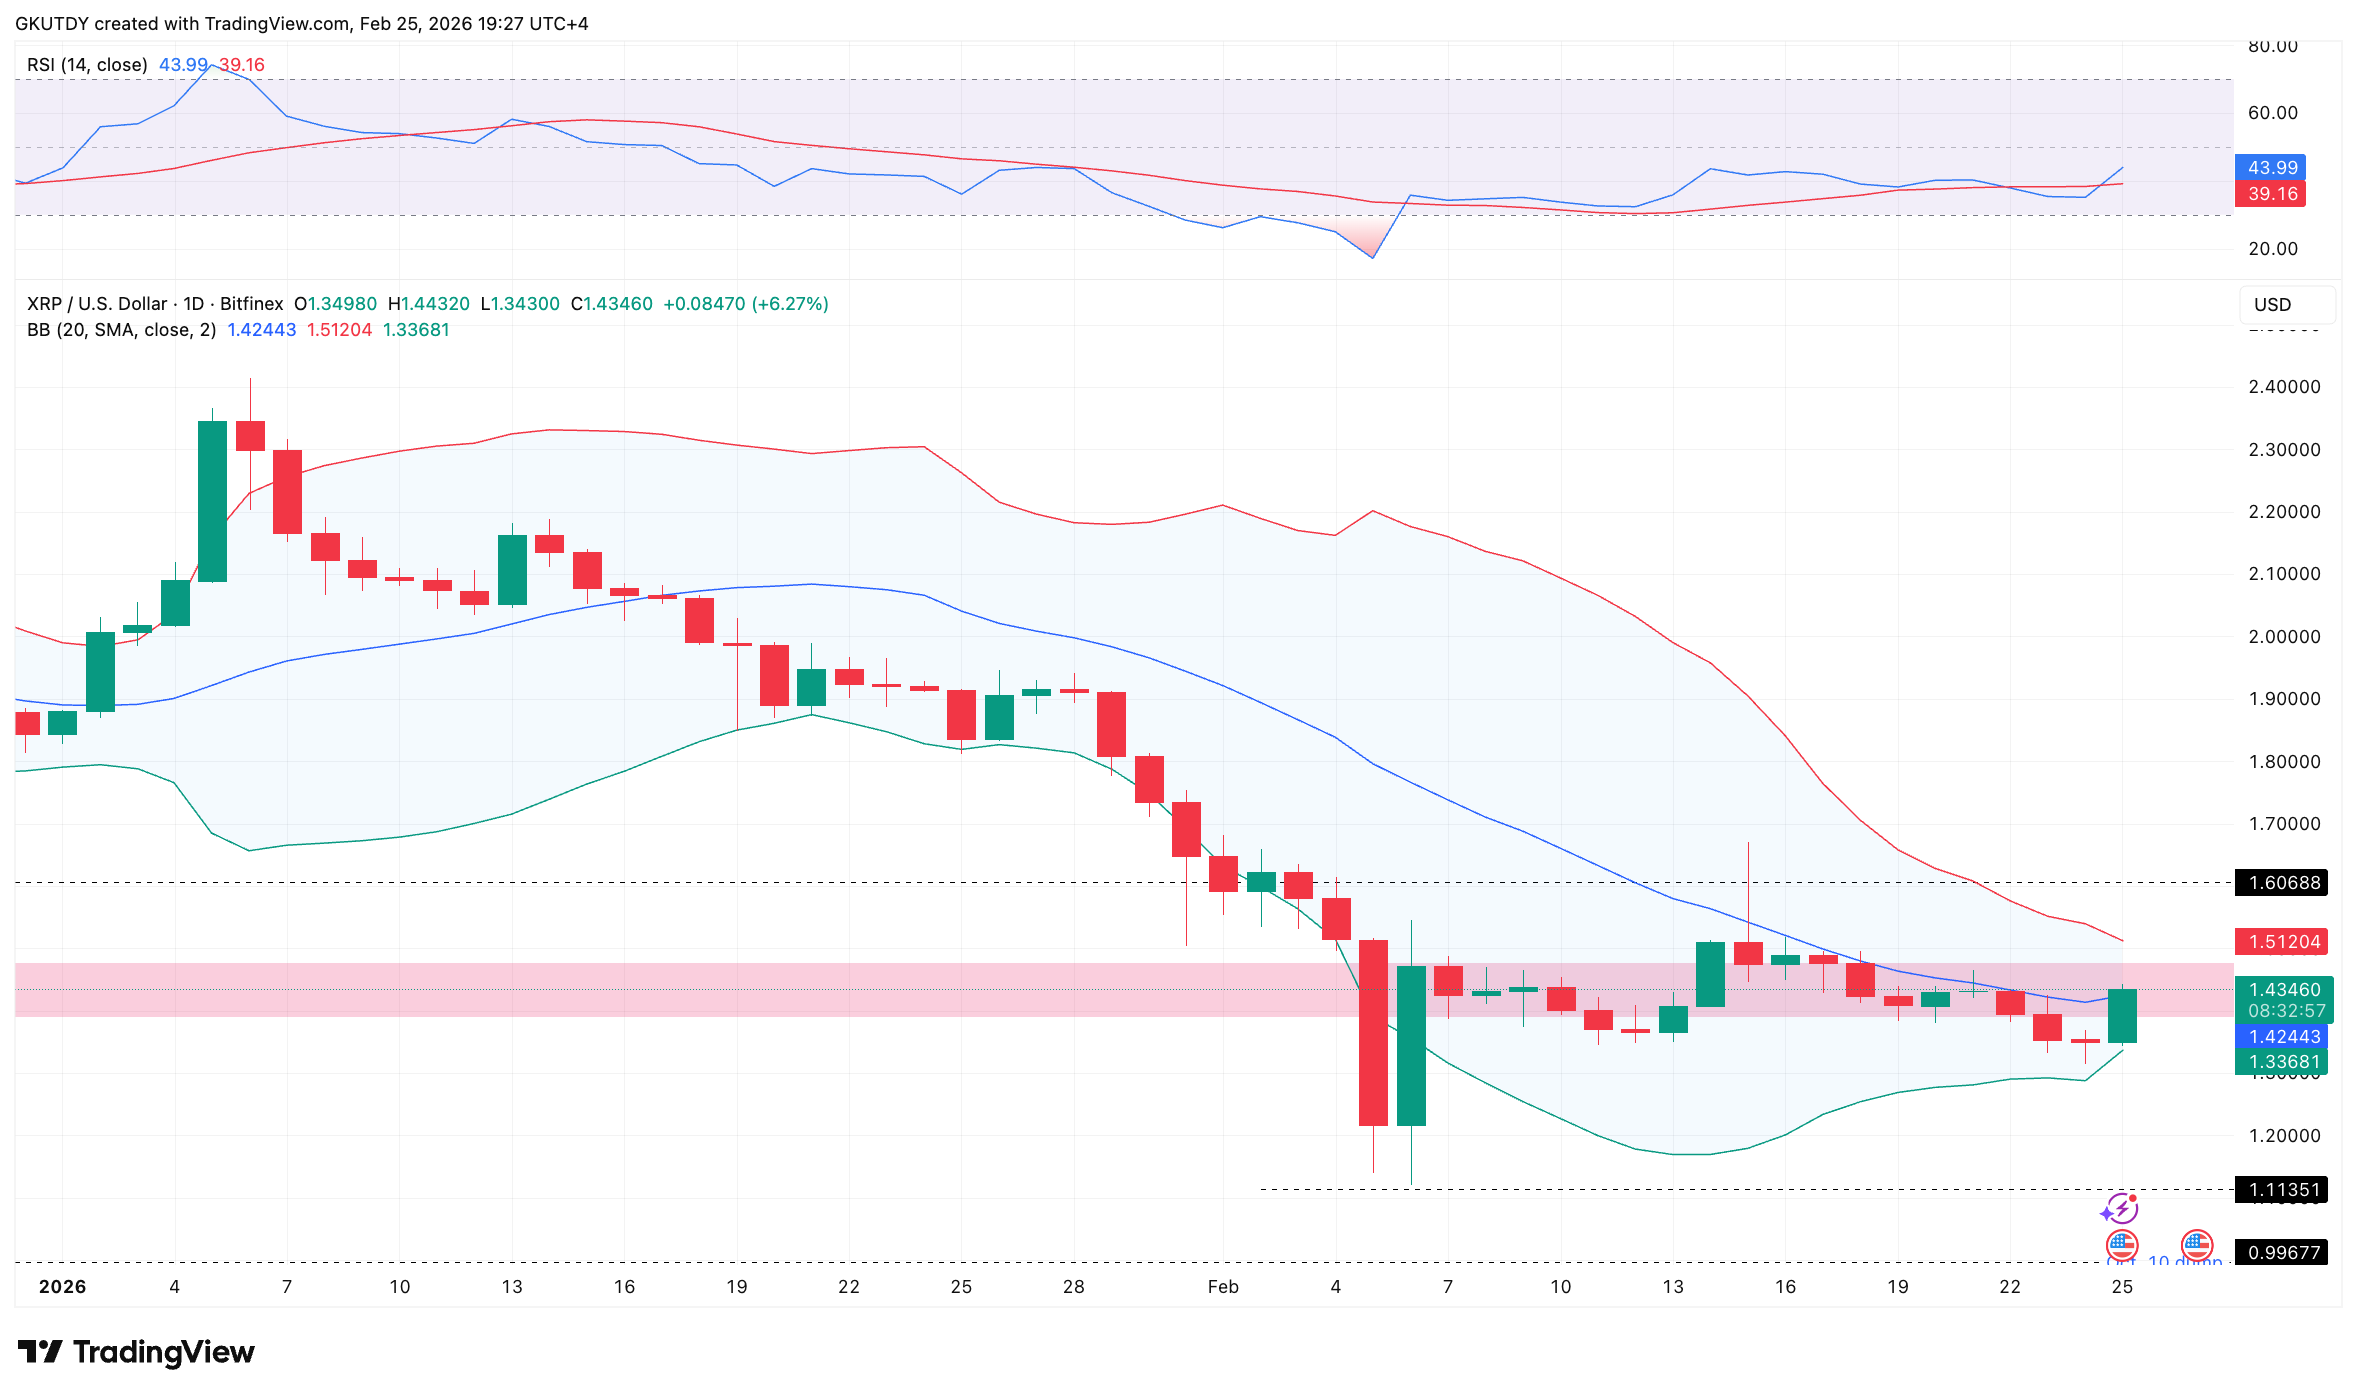
Additionally, the 14-day RSI sits at 44.75. This remains in neutral territory, indicating there is potential for further upside without the coin becoming overbought.
Historically, February has been one of $XRP’s weakest months. Data going back to 2013 shows a median February return of -9.02%. However, the same data shows strong average gains in March (+18.1%) and April (+24.8%), which often follow weak February performances.
For now, the focus is simple: can $XRP hold above $1.42 and push through the upper Bollinger Band near $1.51? If so, the path to $1.50 will be much smoother. The next few days will be closely watched by traders as a close above $1.51 on decent volume would confirm a shift from weakness to strength.