
Elliot Wave Analyst Predicts Bitcoin Price Will Crash In Final Move, What’s The Target?

By:Newsbtc
According to a new forecast from an Elliott Wave analyst, the Bitcoin price could be gearing up for more pain as bearish pressures continue to weigh heavily on it. As a bear market move, the analyst has projected that Bitcoin could crash by more than 14% from its current price near $65,000.
Bitcoin Price Readies For Final Bear Market Plunge
Elliott Wave Strategy, a market expert on X who focuses primarily on Elliott Wave structures and analysis, has warned that Bitcoin is entering its final leg down of its currentbear market cycle. In his updated post, the analyst declared that BTC’s correctiveWave 4 structure has ended precisely as projected. He summarized the outlook bluntly, stating that the relief phase is finally over and Wave 5 is now in motion.

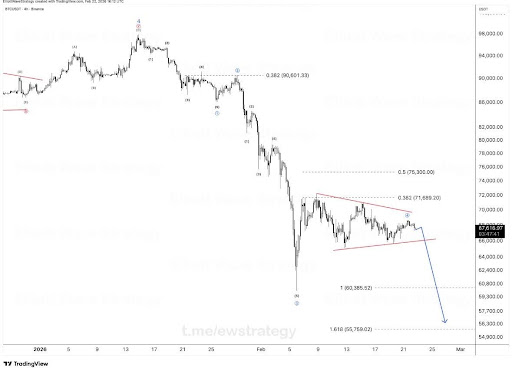
The accompanying TradingView chart shows Wave 5 beginning at the end of a triangle formation, which marked Wave 4. The projected target for the final wave has been clearly defined, with the first measured move expected to drag Bitcoin’s price down toward the 1.0 Fibonacci Retracement level at $60,385.
var rnd = window.rnd || Math.floor(Math.random()*10e6); var pid607465 = window.pid607465 || rnd; var plc607465 = window.plc607465 || 0; var abkw = window.abkw || ''; var absrc = 'https://servedbyadbutler.com/adserve/;ID=172179;size=0x0;setID=607465;type=js;sw='+screen.width+';sh='+screen.height+';spr='+window.devicePixelRatio+';kw='+abkw+';pid='+pid607465+';place='+(plc607465++)+';rnd='+rnd+';click=CLICK_MACRO_PLACEHOLDER'; document.write('
');
if (!window.AdButler){(function(){var s = document.createElement("script"); s.async = true; s.type = "text/javascript";s.src = "https://servedbyadbutler.com/app.js";var n = document.getElementsByTagName("script")[0]; n.parentNode.insertBefore(s, n);}());}
var AdButler = AdButler || {}; AdButler.ads = AdButler.ads || []; var abkw = window.abkw || ""; var plc366606 = window.plc366606 || 0; (function(){ var divs = document.querySelectorAll(".plc366606:not([id])"); var div = divs[divs.length-1]; div.id = "placement_366606_"+plc366606; AdButler.ads.push({handler: function(opt){ AdButler.register(172179, 366606, [728,90], "placement_366606_"+opt.place, opt); }, opt: { place: plc366606++, keywords: abkw, domain: "servedbyadbutler.com", click:"CLICK_MACRO_PLACEHOLDER" }}); })();
 Source:
Chart from Elliott Wave Strategy on X
Source:
Chart from Elliott Wave Strategy on X
Elliott Wave Strategy has also forecasted apotential market bottom. He expects Bitcoin to decline further to the next bearish target at $55,759, marked by the 1.618 Fibonacci level. Based on the expert’s analysis, BTC’s current structure shows no clear signs ofa possible recovery until it completes its correction. As a result, the analyst has urged investors and traders to brace for the potential decline to $55,759, which could wipe out more than 55% of BTC’s value from itsATH levels above $126,000.
A Recap Of Bitcoin’s Wave 4 Performance
Based on the wave count displayed on the Elliott Wave Strategy’s chart, Bitcoin has already completed Waves 1 through 4 of afive-wave bearish impulse. The structure shows an earlier price breakdown from above $90,000, slicing through the 0.382 retracement at $90,601 before accelerating below $75,300, which coincided with the 0.5 retracement level. Following this,Bitcoin continued its downward spiral below the 0.382 Fibonacci Retracement at $71,689.20, marking the start of the Wave 4 consolidation.

Here’s What’s Driving The Bitcoin Price Crash Toward $60,0000
In a previous analysis, Elliott Wave Strategy noted that Bitcoin had already entered its corrective Wave 4 structure as of February 12. He warned that thetemporary rally above $71,000 that preceded the onset of Wave 4 should not be mistaken for a new bull market cycle, reinforcing his predominantly bearish stance on BTC.
var rnd = window.rnd || Math.floor(Math.random()*10e6); var pid607472 = window.pid607472 || rnd; var plc607472 = window.plc607472 || 0; var abkw = window.abkw || ''; var absrc = 'https://servedbyadbutler.com/adserve/;ID=172179;size=0x0;setID=607472;type=js;sw='+screen.width+';sh='+screen.height+';spr='+window.devicePixelRatio+';kw='+abkw+';pid='+pid607472+';place='+(plc607472++)+';rnd='+rnd+';click=CLICK_MACRO_PLACEHOLDER'; document.write('
');
if (!window.AdButler){(function(){var s = document.createElement("script"); s.async = true; s.type = "text/javascript";s.src = "https://servedbyadbutler.com/app.js";var n = document.getElementsByTagName("script")[0]; n.parentNode.insertBefore(s, n);}());}
var AdButler = AdButler || {}; AdButler.ads = AdButler.ads || []; var abkw = window.abkw || ""; var plc452518 = window.plc452518 || 0; (function(){ var divs = document.querySelectorAll(".plc452518:not([id])"); var div = divs[divs.length-1]; div.id = "placement_452518_"+plc452518; AdButler.ads.push({handler: function(opt){ AdButler.register(172179, 452518, [728,90], "placement_452518_"+opt.place, opt); }, opt: { place: plc452518++, keywords: abkw, domain: "servedbyadbutler.com", click:"CLICK_MACRO_PLACEHOLDER" }}); })();
The now-completed Wave 4 triangle has been capped by descending resistance near $70,000 and supported by a rising trendline around $66,000. Elliott Wave Strategy characterized this trendline as a classicbearish continuation pattern, suggesting further downside pressure for BTC’s already weak price.
 BTC trading at $65,382 on the 1D chart | Source: BTCUSDT on
Tradingview.com
BTC trading at $65,382 on the 1D chart | Source: BTCUSDT on
Tradingview.com
var rnd = window.rnd || Math.floor(Math.random()*10e6); var pid607473 = window.pid607473 || rnd; var plc607473 = window.plc607473 || 0; var abkw = window.abkw || ''; var absrc = 'https://servedbyadbutler.com/adserve/;ID=172179;size=0x0;setID=607473;type=js;sw='+screen.width+';sh='+screen.height+';spr='+window.devicePixelRatio+';kw='+abkw+';pid='+pid607473+';place='+(plc607473++)+';rnd='+rnd+';click=CLICK_MACRO_PLACEHOLDER'; document.write('
');
if (!window.AdButler){(function(){var s = document.createElement("script"); s.async = true; s.type = "text/javascript";s.src = 'https://servedbyadbutler.com/app.js';var n = document.getElementsByTagName("script")[0]; n.parentNode.insertBefore(s, n);}());}
var AdButler = AdButler || {}; AdButler.ads = AdButler.ads || []; var abkw = window.abkw || ''; var plc452519 = window.plc452519 || 0; (function(){ var divs = document.querySelectorAll(".plc452519:not([id])"); var div = divs[divs.length-1]; div.id = "placement_452519_"+plc452519; AdButler.ads.push({handler: function(opt){ AdButler.register(172179, 452519, [728,90], 'placement_452519_'+opt.place, opt); }, opt: { place: plc452519++, keywords: abkw, domain: 'servedbyadbutler.com', click:'CLICK_MACRO_PLACEHOLDER' }}); })();
0
0
Disclaimer: The content of this article solely reflects the author's opinion and does not represent the platform in any capacity. This article is not intended to serve as a reference for making investment decisions.
PoolX: Earn new token airdrops
Lock your assets and earn 10%+ APR
Lock now!
You may also like
Why did Netflix decide not to proceed with its acquisition of Warner Bros.?
101 finance•2026/02/28 22:36

Ethereum Holder Retention Rebounds From a 4-Year Low
BeInCrypto•2026/02/28 22:22
Metallic Minerals Pre-PDAC: Strategically Positioned for a Potential Range Breakout
101 finance•2026/02/28 22:21
日股收市:日经225指数跌0.48%,Lasertec半导体跌超5%
moomoo-证劵•2026/02/28 22:06
Trending news
MoreCrypto prices
MoreBitcoin
BTC
$66,991.6
+2.40%
Ethereum
ETH
$1,966.13
+2.69%
Tether USDt
USDT
$1
+0.02%
XRP
XRP
$1.38
+2.23%
BNB
BNB
$617.37
+1.21%
USDC
USDC
$0.9999
-0.01%
Solana
SOL
$84.69
+4.34%
TRON
TRX
$0.2821
-0.18%
Dogecoin
DOGE
$0.09419
+1.53%
Cardano
ADA
$0.2807
+1.75%
How to buy BTC
Bitget lists BTC – Buy or sell BTC quickly on Bitget!
Trade now
Become a trader now?A welcome pack worth 6200 USDT for new users!
Sign up now