
Analyst Predicts Bitcoin Price Surge To $500,000 As Ribbon Fractal Emerges

By:Newsbtc
A prominent market commentator has projected that the Bitcoin price could climb as high as $500,000, citing the reappearance of a long-observed moving average ribbon pattern on the monthly chart. The forecast, shared by Egrag Crypto on X, ties price structure to specific time windows in 2026 and 2028, arguing that technical alignment is outweighing short-term market narratives.pl
Bitcoin Price Ribbon Setup Signals Expansion Phase
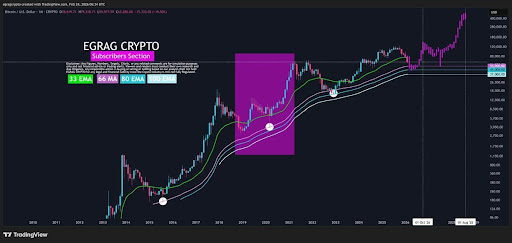
At the center of the $500,000 prediction is the reformation of a multi-layer moving average ribbon on the one-month timeframe. The chart provided by the analyst shows the 33 EMA, 66 MA, 80 EMA, and 100 EMA compressing and beginning to expand in a configuration that has historically marked major cycle transitions.

 Source: X
This structure is not presented in isolation. In previous cycles, similar ribbon compressions were followed by decisive impulsive advances. The analyst points to an earlier period on the chart when the price consolidated within the ribbon before accelerating sharply upward, forming a pattern that now appears to be repeating. Because this setup mirrors prior cycle behavior, he characterizes it as a fractal, indicating structural similarity across different market phases.
var rnd = window.rnd || Math.floor(Math.random()*10e6); var pid607465 = window.pid607465 || rnd; var plc607465 = window.plc607465 || 0; var abkw = window.abkw || ''; var absrc = 'https://servedbyadbutler.com/adserve/;ID=172179;size=0x0;setID=607465;type=js;sw='+screen.width+';sh='+screen.height+';spr='+window.devicePixelRatio+';kw='+abkw+';pid='+pid607465+';place='+(plc607465++)+';rnd='+rnd+';click=CLICK_MACRO_PLACEHOLDER'; document.write('
');
if (!window.AdButler){(function(){var s = document.createElement("script"); s.async = true; s.type = "text/javascript";s.src = "https://servedbyadbutler.com/app.js";var n = document.getElementsByTagName("script")[0]; n.parentNode.insertBefore(s, n);}());}
var AdButler = AdButler || {}; AdButler.ads = AdButler.ads || []; var abkw = window.abkw || ""; var plc366606 = window.plc366606 || 0; (function(){ var divs = document.querySelectorAll(".plc366606:not([id])"); var div = divs[divs.length-1]; div.id = "placement_366606_"+plc366606; AdButler.ads.push({handler: function(opt){ AdButler.register(172179, 366606, [728,90], "placement_366606_"+opt.place, opt); }, opt: { place: plc366606++, keywords: abkw, domain: "servedbyadbutler.com", click:"CLICK_MACRO_PLACEHOLDER" }}); })();
The ribbon’s position relative to current price action reinforces the broader thesis. Bitcoin remains structurally above the layered averages, a condition that in earlier cycles preceded sustained upside rather than distribution. When price reclaimed and held above this cluster in the past, expansion phases followed. Based on those historical expansion multiples, the analyst outlines an intermediate target near $150,000 and extends the upper boundary of the move toward $500,000.
This framework deliberately shifts focus away from sentiment-driven fluctuations. Instead, the moving averages are treated as objective markers of where Bitcoin stands within its long-term cycle, forming the analytical foundation for the half-million-dollar projection.
Timing Window Points To 2026 And Late 2028 Alignment
Building on the structural case, the forecast also incorporates a defined timeline. The chart highlights October 2026 as a key waypoint, aligning with a potential continuation phase if the emerging ribbon fractal develops in line with historical precedent.
var rnd = window.rnd || Math.floor(Math.random()*10e6); var pid607472 = window.pid607472 || rnd; var plc607472 = window.plc607472 || 0; var abkw = window.abkw || ''; var absrc = 'https://servedbyadbutler.com/adserve/;ID=172179;size=0x0;setID=607472;type=js;sw='+screen.width+';sh='+screen.height+';spr='+window.devicePixelRatio+';kw='+abkw+';pid='+pid607472+';place='+(plc607472++)+';rnd='+rnd+';click=CLICK_MACRO_PLACEHOLDER'; document.write('
');
if (!window.AdButler){(function(){var s = document.createElement("script"); s.async = true; s.type = "text/javascript";s.src = "https://servedbyadbutler.com/app.js";var n = document.getElementsByTagName("script")[0]; n.parentNode.insertBefore(s, n);}());}
var AdButler = AdButler || {}; AdButler.ads = AdButler.ads || []; var abkw = window.abkw || ""; var plc452518 = window.plc452518 || 0; (function(){ var divs = document.querySelectorAll(".plc452518:not([id])"); var div = divs[divs.length-1]; div.id = "placement_452518_"+plc452518; AdButler.ads.push({handler: function(opt){ AdButler.register(172179, 452518, [728,90], "placement_452518_"+opt.place, opt); }, opt: { place: plc452518++, keywords: abkw, domain: "servedbyadbutler.com", click:"CLICK_MACRO_PLACEHOLDER" }}); })();
Beyond that initial window, a second period is identified around the end of the third quarter or the beginning of the fourth quarter of 2028. The analyst references election cycles as a contextual factor, suggesting that macro narrative and technical structure could converge during that timeframe.
The Multi-Year XRP Bull Market That Could Change Everything Forever
The projected path on the chart reflects this staged process. Rather than a single vertical surge, it outlines a series of consolidations followed by accelerations, echoing previous cycles before peak expansion.
By integrating price structure with calendar timing, the projection frames the $500,000 target as the culmination of a repeatable cyclical pattern. In this context, the ribbon fractal is positioned not as speculative optimism, but as the structural roadmap underpinning the analyst’s expectation of a potential surge toward half a million dollars.
var rnd = window.rnd || Math.floor(Math.random()*10e6); var pid607473 = window.pid607473 || rnd; var plc607473 = window.plc607473 || 0; var abkw = window.abkw || ''; var absrc = 'https://servedbyadbutler.com/adserve/;ID=172179;size=0x0;setID=607473;type=js;sw='+screen.width+';sh='+screen.height+';spr='+window.devicePixelRatio+';kw='+abkw+';pid='+pid607473+';place='+(plc607473++)+';rnd='+rnd+';click=CLICK_MACRO_PLACEHOLDER'; document.write('
');
if (!window.AdButler){(function(){var s = document.createElement("script"); s.async = true; s.type = "text/javascript";s.src = 'https://servedbyadbutler.com/app.js';var n = document.getElementsByTagName("script")[0]; n.parentNode.insertBefore(s, n);}());}
var AdButler = AdButler || {}; AdButler.ads = AdButler.ads || []; var abkw = window.abkw || ''; var plc452519 = window.plc452519 || 0; (function(){ var divs = document.querySelectorAll(".plc452519:not([id])"); var div = divs[divs.length-1]; div.id = "placement_452519_"+plc452519; AdButler.ads.push({handler: function(opt){ AdButler.register(172179, 452519, [728,90], 'placement_452519_'+opt.place, opt); }, opt: { place: plc452519++, keywords: abkw, domain: 'servedbyadbutler.com', click:'CLICK_MACRO_PLACEHOLDER' }}); })();
 BTC clears $68,000 | Source:
Featured image created with Dall.E, chart from Tradingview.com
0
0
Disclaimer: The content of this article solely reflects the author's opinion and does not represent the platform in any capacity. This article is not intended to serve as a reference for making investment decisions.
PoolX: Earn new token airdrops
Lock your assets and earn 10%+ APR
Lock now!
You may also like
Gold price to accelerate and hit new record highs after this event – technical analyst
kitco•2026/03/03 10:00
Satya Nadella Says AI Will Displace Workers-'Best Protection...Transform Yourself'
Finviz•2026/03/03 10:00
European Gas: Qatar supply shock lifts TTF – Rabobank
101 finance•2026/03/03 09:57
Gold price to accelerate and hit new record highs after this event – technical analyst
kitco•2026/03/03 09:57
Trending news
MoreCrypto prices
MoreBitcoin
BTC
$66,608.15
+0.45%
Ethereum
ETH
$1,948.03
-0.18%
Tether USDt
USDT
$1.0000
+0.01%
BNB
BNB
$622.22
+0.42%
XRP
XRP
$1.35
-0.62%
USDC
USDC
$1
+0.01%
Solana
SOL
$84.24
+0.56%
TRON
TRX
$0.2812
-0.23%
Dogecoin
DOGE
$0.08963
-2.91%
Cardano
ADA
$0.2647
-2.81%
How to buy BTC
Bitget lists BTC – Buy or sell BTC quickly on Bitget!
Trade now
Become a trader now?A welcome pack worth 6200 USDT for new users!
Sign up now