Synchrony (SYF) Has Dropped 0.8% Following Its Latest Earnings Release: Is a Recovery Possible?

Synchrony (SYF) Recent Performance and Earnings Overview
Over the past month, Synchrony (SYF) shares have slipped by approximately 0.8%, lagging behind the S&P 500 index. This has left investors questioning whether this downward trend will persist ahead of the next earnings announcement, or if the company is poised for a turnaround. To better understand the current situation, let's review the most recent quarterly results and the factors influencing Synchrony's performance, as well as how analysts and investors have responded.
Fourth Quarter 2025: Earnings Highlights
In the fourth quarter of 2025, Synchrony Financial reported adjusted earnings per share (EPS) of $2.18, exceeding the Zacks Consensus Estimate by 8.1% and improving from $1.91 per share in the prior year. Net interest income reached $4.8 billion, marking a 3.7% increase year over year, though it narrowly missed consensus expectations by 0.6%.
The company benefited from higher purchase volumes, a stronger net interest margin, and increased interest and fees on loans across platforms such as Digital and Health & Wellness. Operational efficiency also improved, and lower provisions for credit losses supported the positive results. However, these gains were partially offset by a decline in total loan receivables and a reduction in average active accounts.
Detailed Q4 Results
- Retailer share arrangements surged 19% year over year to $1.1 billion.
- Total loan receivables stood at $103.8 billion, down 0.9% from the previous year and below the consensus estimate of $104.3 billion.
- Total deposits declined 1.1% year over year to $81.1 billion, missing the projected $81.5 billion.
- Provisions for credit losses dropped 7.6% to $1.4 billion, aided by fewer net charge-offs, and came in below the expected $1.8 billion.
- Purchase volume increased 3.2% to $49.5 billion, surpassing the estimate of $48.5 billion, driven by stronger consumer spending.
- Interest and fees on loans reached $5.5 billion, up 1% year over year but slightly below the $5.6 billion estimate, supported by higher loan receivables yield but tempered by lower benchmark rates and fewer late fees.
- Net interest margin improved by 82 basis points to 15.8%, just above the consensus estimate of 15.7%.
- Average active accounts totaled 69.3 million, a 1.4% decrease year over year, but still ahead of both the consensus and internal estimates.
- Other expenses rose 10.4% to $1.4 billion, exceeding the $1.3 billion estimate. The efficiency ratio improved by 360 basis points to 36.9%, outperforming the consensus mark of 32.7%.
Performance Across Sales Platforms
- Home & Auto: Loan receivables at period-end fell 5.4% year over year, with purchase volume down 1.6% due to fewer active accounts and weaker spending in Home Improvement. Interest and fees on loans dropped 2.2%.
- Digital: Loan receivables rose 2.4%, while purchase volume climbed 5.8% thanks to increased spending per account and enhanced product offerings. Interest and fees on loans grew 5.1%.
- Diversified & Value: Loan receivables increased 1.8%, purchase volume rose 4.5% due to new partnerships, though interest and fees on loans dipped 0.5%.
- Health & Wellness: Loan receivables edged up 0.7%, purchase volume advanced 4.1% with growth in Pet and Audiology segments, and interest and fees on loans rose 4.7%.
- Lifestyle: Loan receivables declined 2.1%, but purchase volume improved 2.8% on broader spending per account. Interest and fees on loans decreased 1.1%.
Financial Position as of December 31, 2025
- Cash and equivalents totaled $15 billion, up from $14.7 billion at the end of 2024.
- Total assets were $119.1 billion, slightly lower than $119.5 billion at the previous year-end.
- Total borrowings stood at $15.2 billion, down from $15.5 billion a year earlier.
- Total equity increased to $16.8 billion from $16.6 billion at the end of 2024.
- Liquidity remained robust at $16.6 billion, representing 13.9% of total assets.
- Return on assets slipped by 10 basis points to 2.5%, while return on equity fell by 130 basis points to 17.6%.
Capital Management
During the fourth quarter, Synchrony returned $952 million to shareholders through stock repurchases and distributed $106 million in common stock dividends. As of year-end, the company had approximately $1.2 billion remaining under its share buyback authorization, which extends through June 30, 2026.
Full-Year 2025 Results
- Adjusted EPS for 2025 reached $9.28, an 8.5% increase over 2024.
- Net interest income totaled $18.5 billion, up 2.5% year over year.
- Purchase volume for the year was $182.3 billion, a slight 0.1% increase.
2026 Outlook
Looking ahead, Synchrony expects period-end loan receivables to grow at a mid-single-digit rate. The company also anticipates increases in purchase volume and average active accounts, along with a higher payment rate. Management forecasts net charge-offs in the range of 5.5% to 6%, and projects EPS for 2026 to fall between $9.10 and $9.50.
Analyst Estimate Revisions
Since the latest earnings report, analyst estimates for Synchrony have generally trended upward, reflecting increased optimism about the company's prospects.
VGM Score Breakdown
Currently, Synchrony holds a D rating for both Growth and Momentum, but earns an A for Value, placing it among the top 20% of stocks for value investors. Its overall VGM Score is a B, making it a solid choice for those seeking a balanced investment approach.
Future Prospects
Analyst projections for Synchrony have been moving higher, and the scale of these upward revisions is encouraging. The stock carries a Zacks Rank #3 (Hold), suggesting that it is expected to perform in line with the market in the coming months.
Disclaimer: The content of this article solely reflects the author's opinion and does not represent the platform in any capacity. This article is not intended to serve as a reference for making investment decisions.
You may also like
GBP/USD: Returns to range following unsuccessful breakout – UOB
RBC's Initiation: Assessing Lilly's Path to Obesity Market Leadership
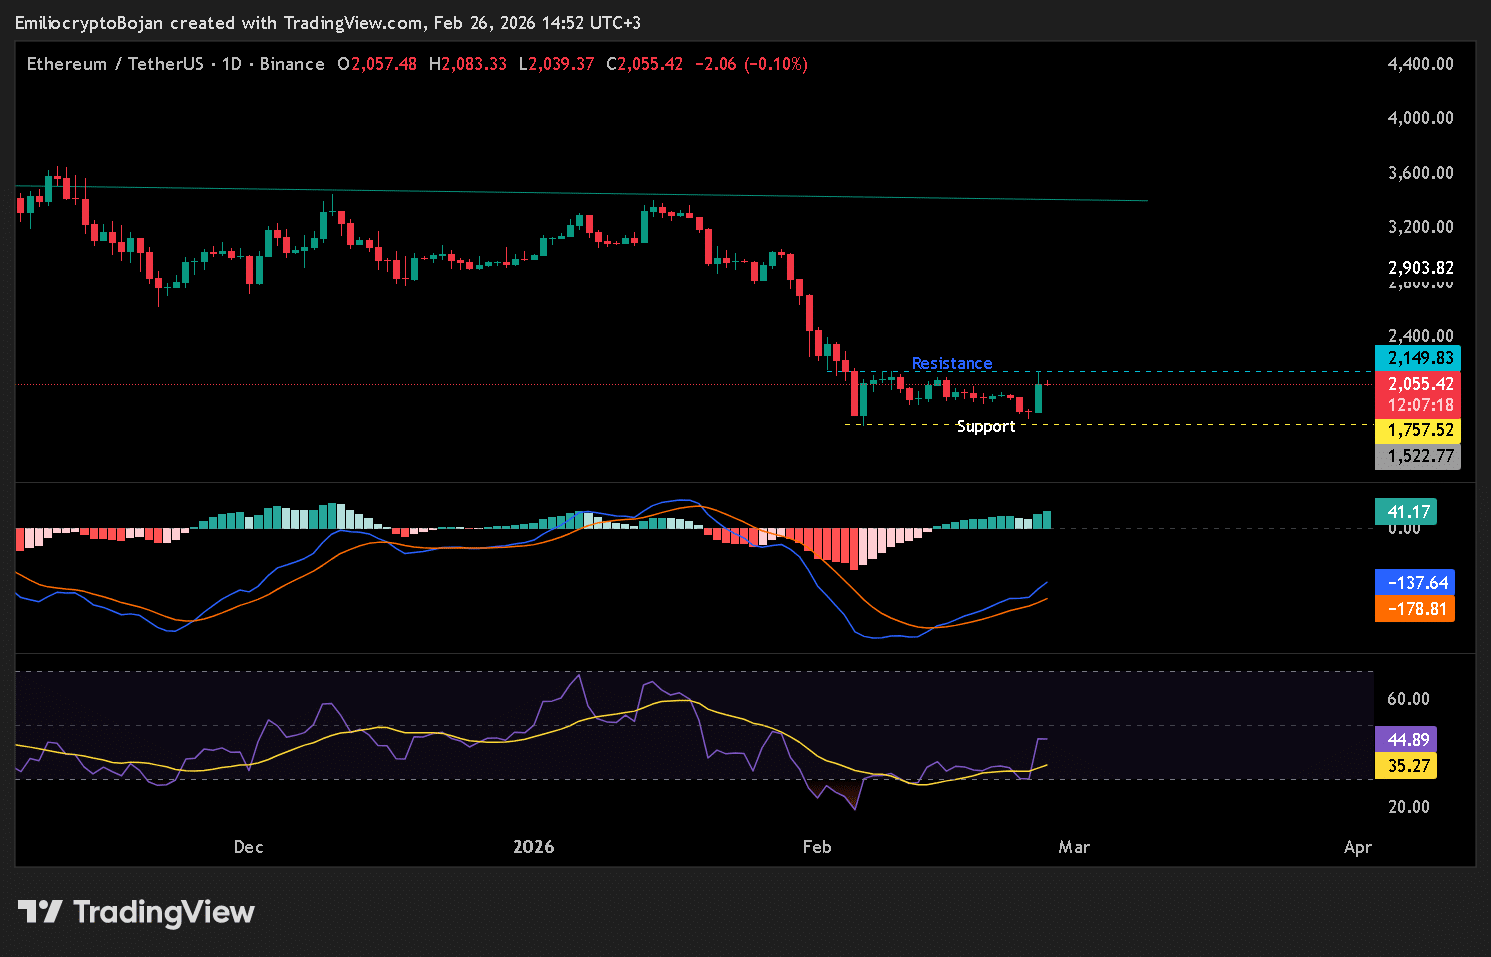
Can Ethereum’s price rally to $2,400 after BlackRock’s latest bet?