

Key Takeaways
- PUMP is forming a double bottom pattern on the daily chart near $0.001680.
- Buyers have defended the $0.001680 support zone twice, signaling weakening selling pressure.
- The 50-day moving average at $0.002346 is the key level for bullish confirmation.
- A breakout above the $0.003357 neckline could validate the reversal setup.
- A breakdown below $0.001680 would invalidate the bullish structure.
Pump.fun’s $PUMP token has posted over a 3% gain over the past 24 hours, bucking recent volatility across the memecoin narrative.
The move comes shortly after blockchain investigator ZachXBT published a high-profile exposé on alleged insider trading at Axiom Exchange. While Pump.fun briefly appeared in early speculation circles and prediction markets, the investigation ultimately focused elsewhere — leaving PUMP free from direct allegations.
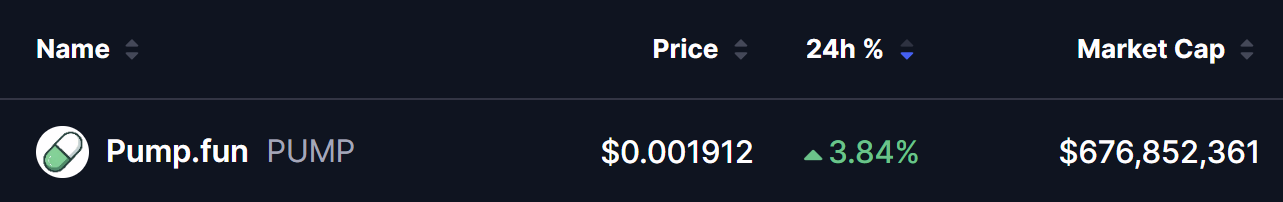 Source: Coinmarketcap
With that uncertainty fading, attention is shifting back to the chart — and technically, things are starting to look constructive.
Technical Pattern Hint at Upside Momentum
On the daily timeframe, PUMP appears to be forming a double bottom pattern, a classic bullish reversal structure that often develops after extended downtrends.
Here’s how the setup is unfolding:
- The first bottom formed as price dropped into the $0.001680 support zone, where buyers stepped in aggressively.
- That rebound carried PUMP toward the neckline resistance near $0.003357, where sellers rejected the rally.
- Price then rolled over and returned to the same $0.001680 region.
- Once again, buyers defended the level — forming the second bottom.
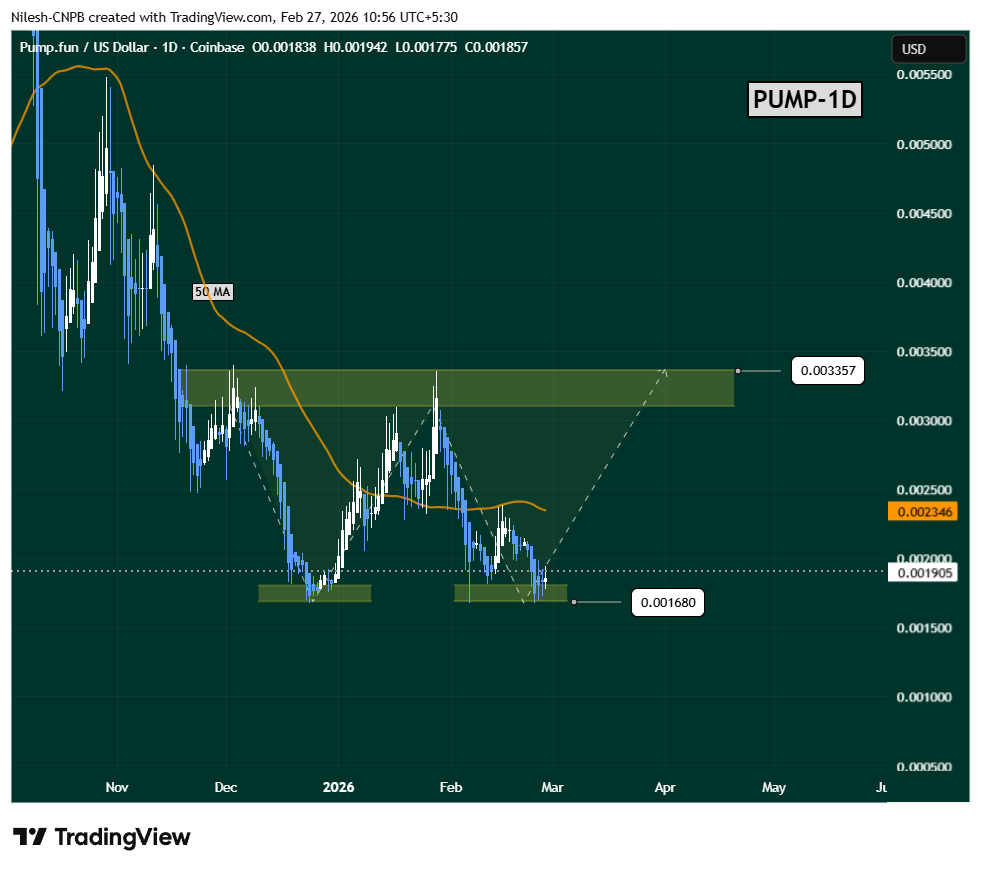 Pump.fun (PUMP) Daily Chart/Coinsprobe (Source: Tradingview)
This repeated defense of $0.001680 is technically significant. It signals that selling pressure is weakening while demand continues to build at lower levels.
PUMP is currently trading near $0.0019, showing early signs of stabilization after the retest.
What’s Next for PUMP?
For this bullish structure to gain real credibility, PUMP needs to reclaim the 50-day moving average near $0.002346. A sustained move above this level would signal a clear shift in short-term momentum and significantly improve the chances of a recovery rally.
If buyers manage to drive price back toward the $0.003357 neckline zone, that area will act as the next major test. A decisive breakout above this resistance — ideally followed by a successful retest to confirm it as new support — would validate the double bottom pattern and potentially pave the way for a stronger upside move in the coming weeks.
On the downside, the $0.001680 support zone remains the most critical level to monitor. A breakdown below this area would invalidate the bullish setup and likely expose PUMP to another leg lower or an extended period of consolidation.
About Author: Nilesh Hembade is the Founder and Lead Author of Coinsprobe, with over 5 years of experience in the cryptocurrency and blockchain industry. Since launching Coinsprobe in 2023, he has been providing daily, research-driven insights through in-depth market analysis, on-chain data, and technical research.