
Bitcoin threatens new breakdown as US PPI sends gold to 1-month high

Bitcoin (BTC) slid further into Friday’s Wall Street open as US inflation data overshot expectations.
Key points:
Bitcoin price downside strengthens as US inflation data comes in hot.
Gold and silver benefit from a risk-off response to January PPI data.
Bitcoin price expectations face the prospect of a rocky monthly candle close.
Bitcoin under pressure after hot US PPI print
Data from showed daily BTC price downside nearing 2.5% on Bitstamp, while gold eyed its highest levels since late January.
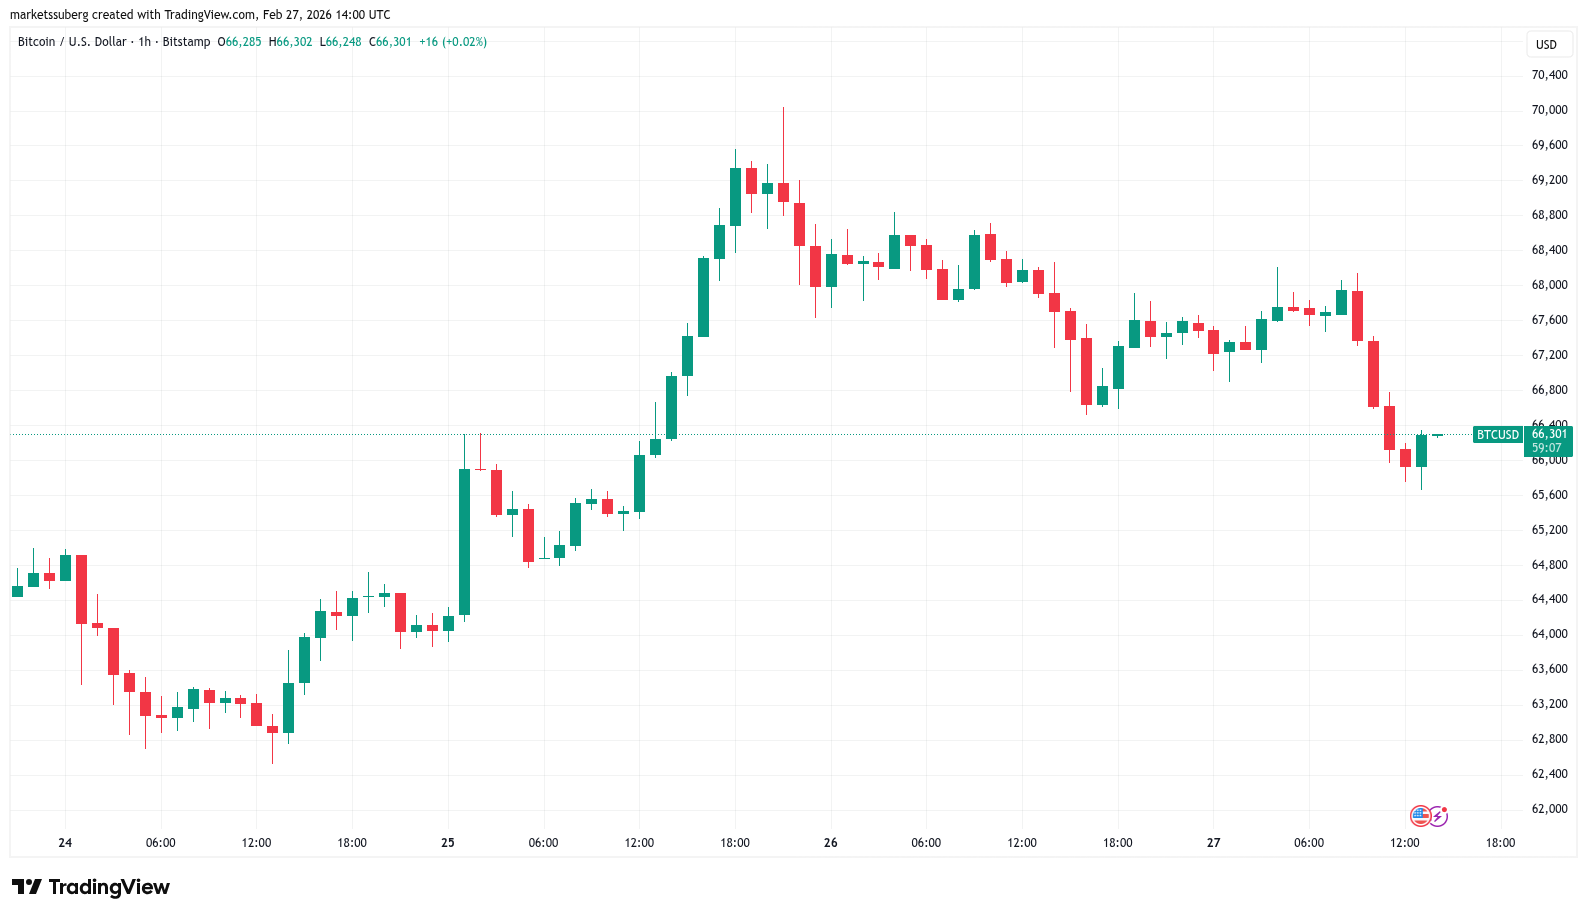 BTC/USD one-hour chart. Source: Cointelegraph/TradingView
The January print of the Producer Price Index (PPI) came in markedly above expectations at 0.5% month over month versus an anticipated 0.3%, per data from the US Bureau of Labor Statistics (BLS).
Core PPI fared even worse at 0.8% month over month instead of 0.3%.
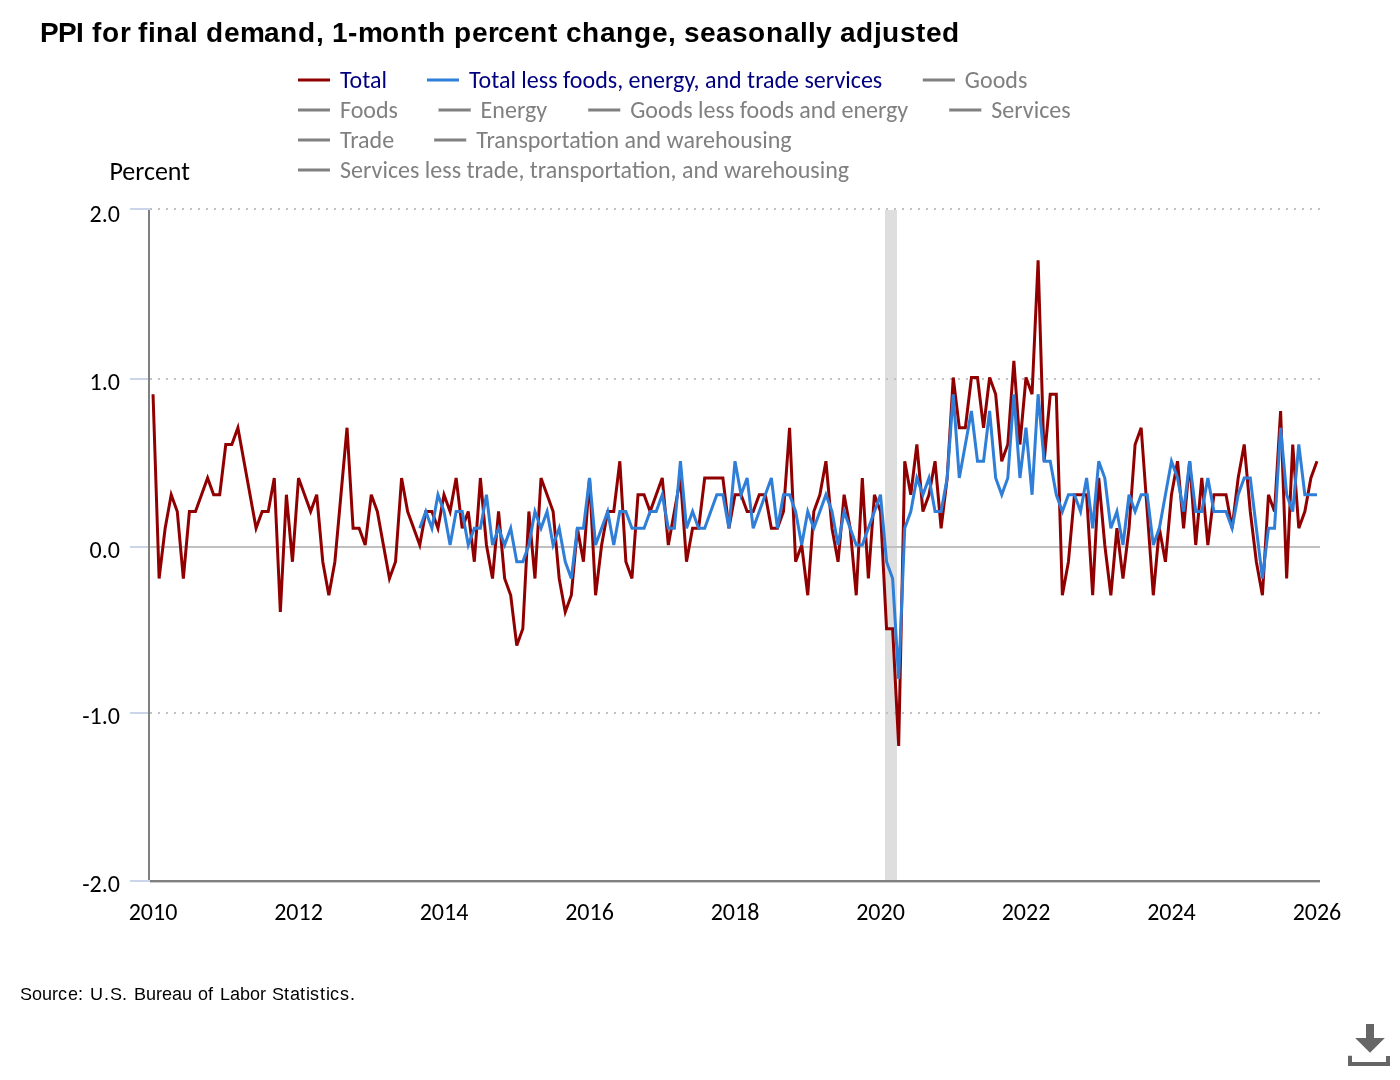 US PPI one-month % change. Source: BLS
“The January increase in prices for final demand can be traced to a 0.8-percent advance in the index for final demand services. In contrast, prices for final demand goods declined 0.3 percent,” an added.
With US inflation creeping higher more quickly than markets assumed, risk-asset pressure increased, while safe havens outperformed.
Gold passed $5,200 per ounce, while silver revisited $92 to hit its highest levels since Jan. 30.
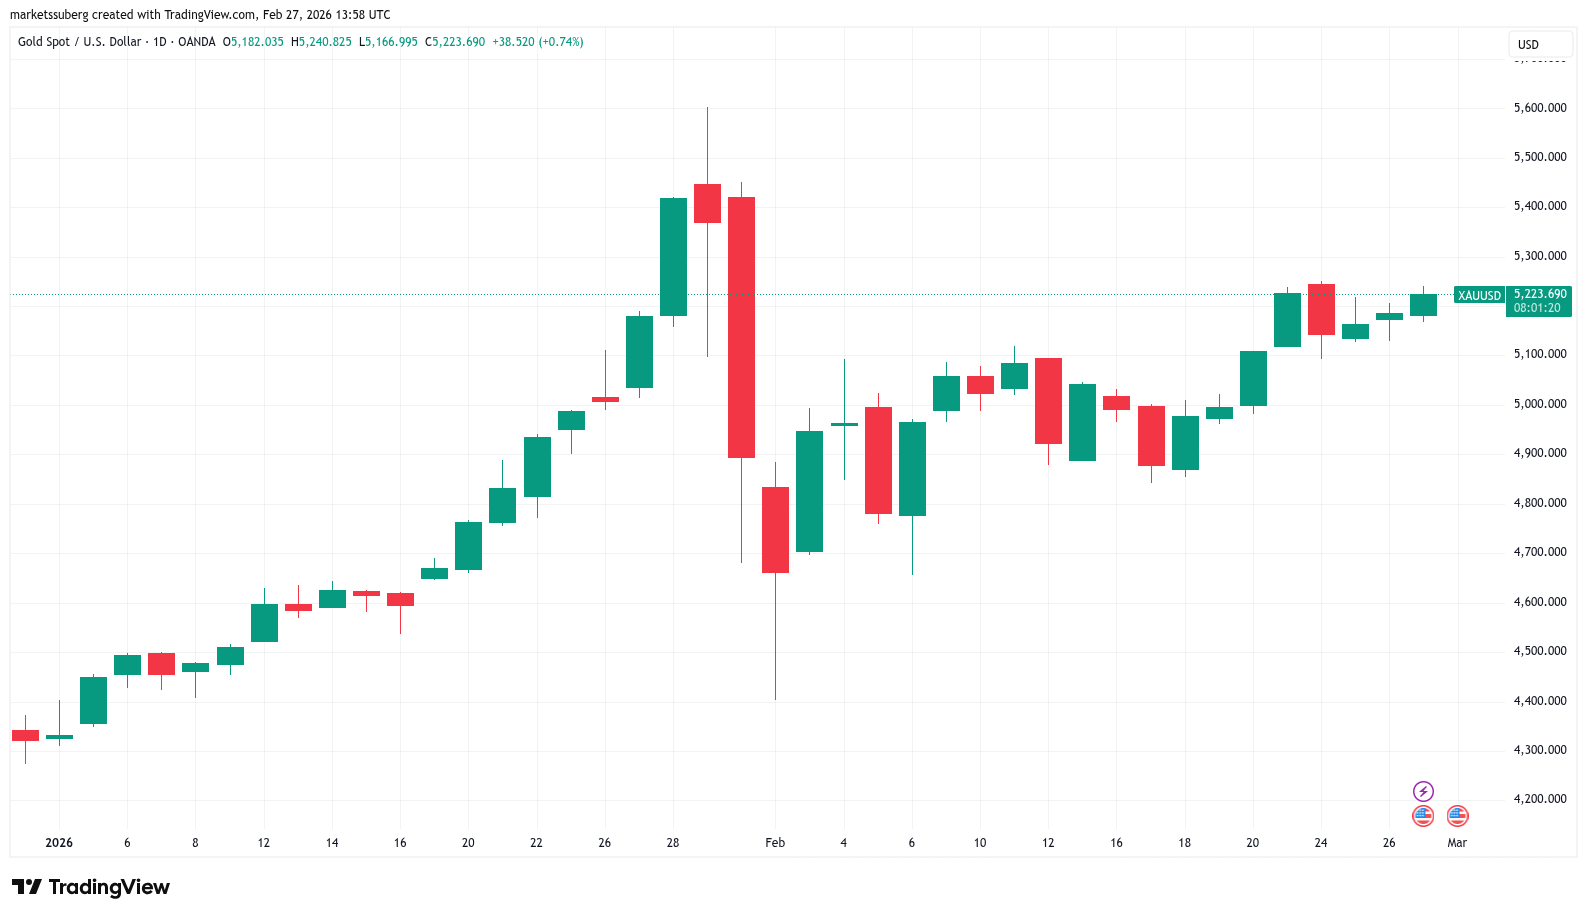 XAU/USD one-day chart. Source: Cointelegraph/TradingView
Expectations for interest-rate cuts by the Federal Reserve at its March meeting fell below 4%, according to the latest readings from CME Group’s .
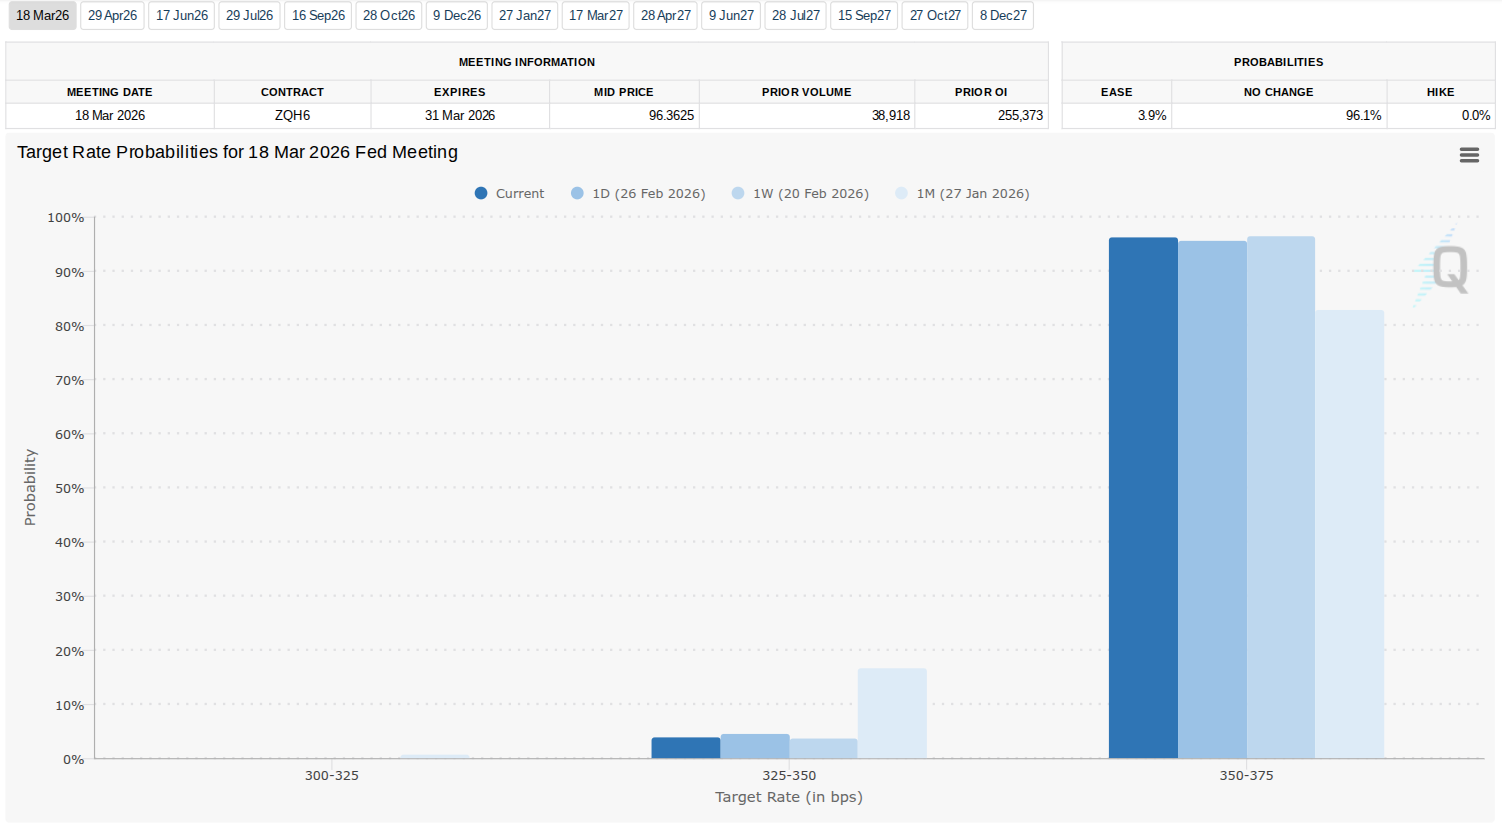 Fed target rate probabilities for March FOMC meeting (screenshot). Source: CME Group
BTC price fears over “massive collapse”
With the monthly close in focus, Bitcoin market participants remained on edge.
Related: Hodlers have ‘given up’ at $65K: Five things to know in Bitcoin this week
Crypto trader, analyst and entrepreneur Michaël van de Poppe warned of a possible rerun of events from early February, where BTC/USD put in 15-month lows near $59,000.
“Pretty crucial area for me to hold on to. I'd highly favor that $BTC finds a higher low at $65k,” he wrote in his latest analysis on X.
“However, last day of the month; remember last month? A massive collapse on the markets. Let's see what it brings: holding $65K opens up the scenario to run up from here.”
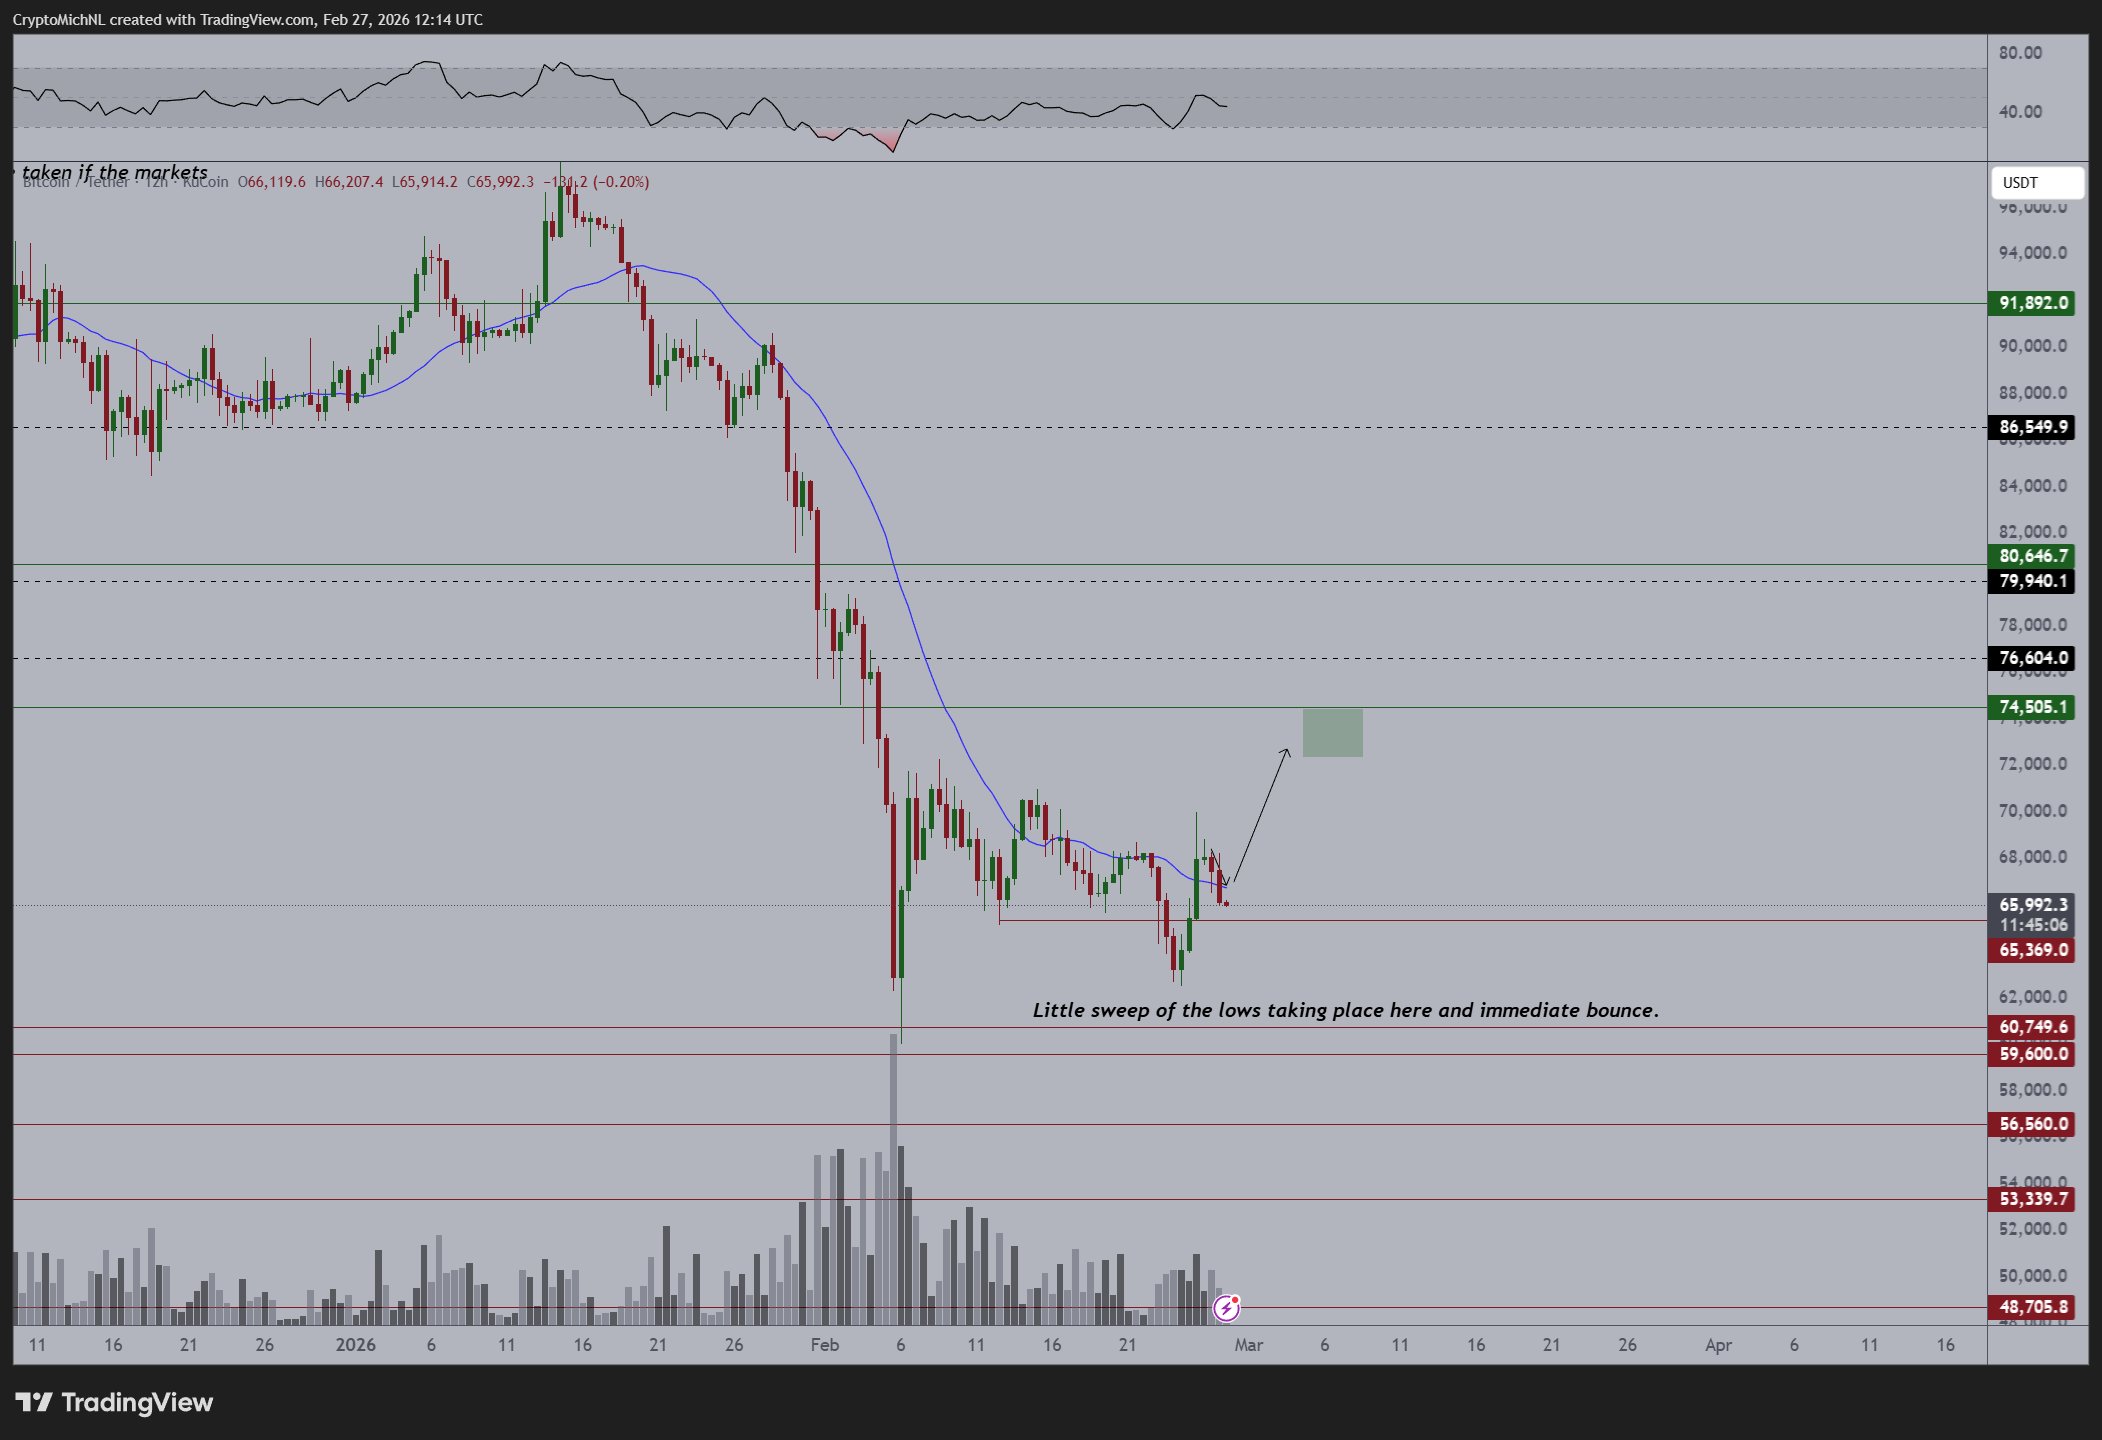 BTC/USDT 12-hour chart. Source: Michaël van de Poppe/X
Earlier, Cointelegraph reported on key resistance levels for bulls to reclaim, notably the 200-week exponential moving average (EMA) and old all-time highs around $69,000.
At the time of writing, BTC/USD roughly matched February 2025 in terms of performance, with losses nearing 17% month-to-date.
The pair prepared its fifth consecutive month of losses, a phenomenon absent from the charts since 2018, data from confirms.
 BTC/USD monthly returns (screenshot). Source: CoinGlass
Disclaimer: The content of this article solely reflects the author's opinion and does not represent the platform in any capacity. This article is not intended to serve as a reference for making investment decisions.
You may also like
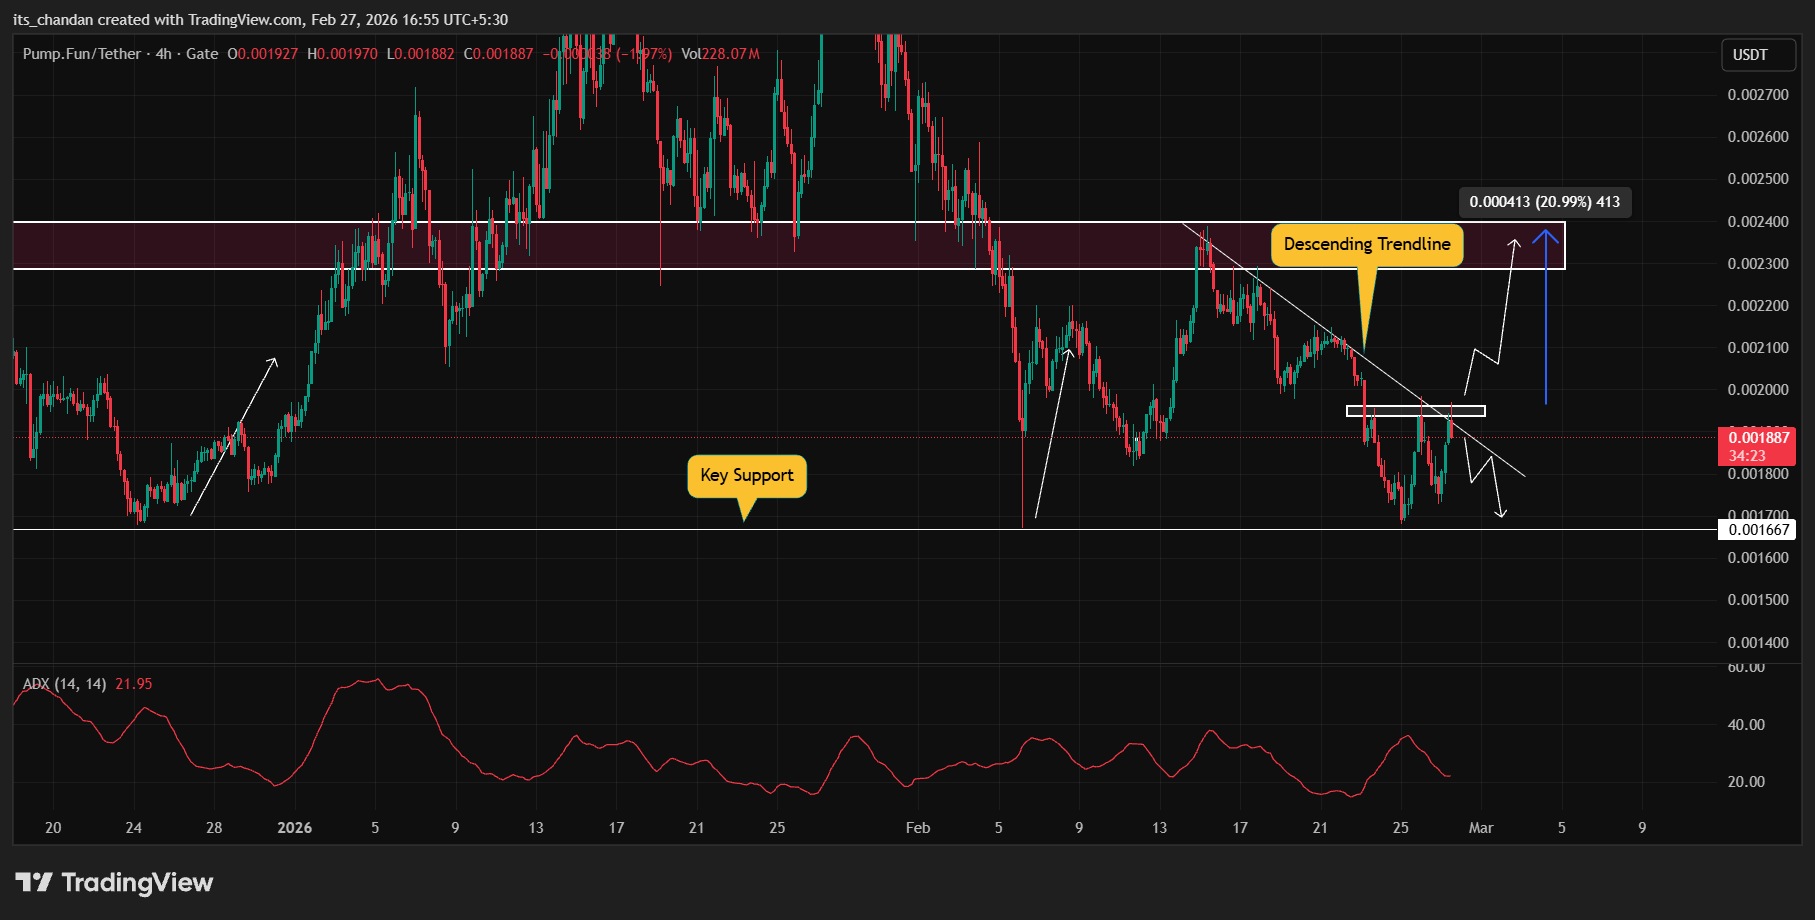
Pump.fun eyes 20% rally if PUMP price breaks THIS hurdle
Why agilon health (AGL) Shares Are Down Today
Week Preview: US Dollar weakens amid trade doubts with NFP and Eurozone HICP approaching
Gold hits $5,260 as war jitters, trade tension rattle markets