Range Resources Beats on Q4 Earnings, Raises Production Guidance

Range Resources Corporation RRC reported fourth-quarter 2025 adjusted earnings of 82 cents per share, which beat the Zacks Consensus Estimate of 68 cents. The bottom line also improved from the prior-year level of 68 cents.
Total quarterly revenues of $811.86 million beat the Zacks Consensus Estimate of $762 million. The top line increased from the prior-year figure of $749.83 million.
Strong quarterly results can be attributed to higher gas-equivalent production and increased natural gas price realization.
Operational Performance of RRC
Production averaged 2,316.5 million cubic feet equivalent per day (Mcfe/d), higher than the year-ago quarter’s 2,202.5 Mcfe/d. The figure also beat our projection of 2,294.5 Mcfe/d. Natural gas contributed approximately 69% to the company’s total production, while NGLs and oil accounted for the rest.
Natural gas production increased 7% year over year. Oil production increased 6%, whereas NGL output grew 2% in the same time frame.
Total price realization (excluding derivative settlements and before third-party transportation costs) averaged $3.50 per Mcfe, up 12% year over year. Notably, price realization beat our estimate of $3.43 per Mcfe. Natural gas price increased 34% on a year-over-year basis to $3.26 per Mcf. NGL price declined 13%, whereas oil price fell 20%.
Range Resources Corporation Price, Consensus and EPS Surprise
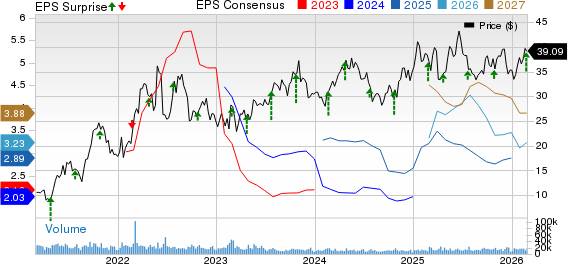
Range Resources Corporation price-consensus-eps-surprise-chart | Range Resources Corporation Quote
RRC’s Costs & Expenses
Total costs and expenses increased 4% year over year to $583.6 million. However, the reported figure came in lower than our projection of $589 million. Transportation, gathering, processing and compression costs, which constitute significant part of the total costs, increased to $311.4 million from $299.4 million in the prior-year quarter.
RRC’s Capital Expenditure & Balance Sheet
Drilling and completion expenditure was $167 million. An additional $10 million was spent on acreage, and $6 million on infrastructure and other investments.
At the end of the fourth quarter, Range Resources reported a total debt of $1,198.3 million, net of deferred financing costs.
Outlook of Range Resources
RRC expects the total production for 2026 to be 2.35-2.40 billion cubic feet equivalent per day (Bcfe/d), of which more than 30% has been attributed to liquid production. The company updated its capital budget for the year to $650-$700 million.
RRC’s Zacks Rank & Stocks to Consider
Currently, Range Resources carries a Zacks Rank #5 (Strong Sell).
Some better-ranked stocks from the energy sector are Archrock, Inc. AROC, TechnipFMC plc FTI and Oceaneering International, Inc. OII. AROC and FTI each sport a Zacks Rank #1 (Strong Buy), while OII has a Zacks Rank #2 (Buy). You can see the complete list of today’s Zacks Rank #1 stocks here.
Archrockreported fourth-quarter 2025 adjusted earnings per share of 69 cents, which beat the Zacks Consensus Estimate of 40 cents. The company’s bottom line improved from the year-ago adjusted profit of 35 cents.
As of Dec. 31, AROC had $1.553 million in cash and cash equivalents, and $2.41 billion in long-term debt.
TechnipFMC posted fourth-quarter 2025 adjusted earnings per share of 70 cents, which beat the Zacks Consensus Estimate of 51 cents. The bottom line increased from the prior-year level of 54 cents.
FTI’s quarterly revenues of $2,517 million improved from $2,367.3 million in the year-ago period. The top line missed the Zacks Consensus Estimate of $2,546.8 million.
As of Dec. 31, FTI had $1,031.9 million in cash and cash equivalents, and $395.7 million in long-term debt, less current portion.
Oceaneering reported fourth-quarter 2025 adjusted earnings per share of 45 cents, which beat the Zacks Consensus Estimate of 44 cents. The bottom line increased from the prior-year level of 37 cents.
OII’s quarterly revenues of $668.6 million declined from $713.4 million in the year-ago period. The top line surpassed the Zacks Consensus Estimate of $711 million.
As of Dec. 31, OII had $1,512.4 million in cash and cash equivalents, and $487.417 million in long-term debt.
Disclaimer: The content of this article solely reflects the author's opinion and does not represent the platform in any capacity. This article is not intended to serve as a reference for making investment decisions.
You may also like
Australian Dollar Forecast: AUD/USD's Six-Week Rally Encounters Significant Challenge Near Long-Term Peaks
Solana Faces Critical Technical Retest as Analysts Identify Key Support Levels
UiPath's Debt-Free Balance Sheet Fuels Strategic Flexibility
Susquehanna Raises Transocean (RIG) Price Target, Barclays Downgrades