SOL drops 4.2% while HYPE sees $570M in Trading: Analyzing the Flow

Broad Liquidity Influx Drives Crypto Markets
Recent movements in the cryptocurrency market are largely fueled by an overall increase in liquidity, rather than a revaluation of specific sectors. Bitcoin experienced a notable jump of 7.31%, reaching $68,837, which contributed approximately $150 billion to the total market capitalization within just one day. This rally is primarily a technical rebound from the $60,000 to $63,000 range, triggered by an abundance of short positions and limited liquidity in derivatives, making a rapid price squeeze almost unavoidable.
The market’s response highlights a shift toward risk-taking, led by Bitcoin. Over the same period, the total crypto market cap rose by 7.5%, closely tracking Bitcoin’s performance. This strong correlation emphasizes Bitcoin’s role as the main indicator of market sentiment and liquidity conditions.
Although positive developments such as potential upgrades and improved regulatory outlooks provide some background, the immediate cause of the rally was a technical bounce after a period of intense selling. Increases in active addresses and daily transaction volumes lend fundamental support, indicating that the recovery is underpinned by genuine user engagement rather than solely speculative trading.
Solana Faces a Key Technical Challenge
Solana is currently at a crucial technical juncture, with its price trends diverging from the broader market’s liquidity-driven gains. The cryptocurrency is testing a significant support level at $76.57, which has defined its recent downward trend. Should Solana fall below this point, it could drop further to $61.73—a decline of nearly 19%—signaling continued bearish pressure.
This downside risk is heightened by the emergence of a Bear Flag pattern on the daily chart, a formation that has been developing since early February. This pattern suggests that Solana’s price is consolidating within a downward channel following a sharp sell-off, reinforcing the prevailing negative outlook. Unlike Bitcoin, Solana has not participated in the market’s relief rally, highlighting its unique challenges.
Recent performance data underscores Solana’s weakness. The token has fallen 4.2% in the past 24 hours, making it one of the biggest underperformers alongside Ethereum, which also saw a decline. This underperformance demonstrates a clear divergence: while Bitcoin’s rally is boosting overall market liquidity, Solana’s technical setup and price action point to significant, ongoing downward pressure.
Hyperliquid’s Standing and Market Strategy
Hyperliquid currently holds the 16th position in market capitalization, valued at BTC127,118, reflecting its established role in the crypto derivatives sector. A key metric for evaluating its market value relative to protocol activity is the MC/TVL ratio, which compares market capitalization to the total value locked within the protocol. A ratio above 1.0 suggests that the market values the protocol at a premium above its secured assets.
Disclaimer: The content of this article solely reflects the author's opinion and does not represent the platform in any capacity. This article is not intended to serve as a reference for making investment decisions.
You may also like
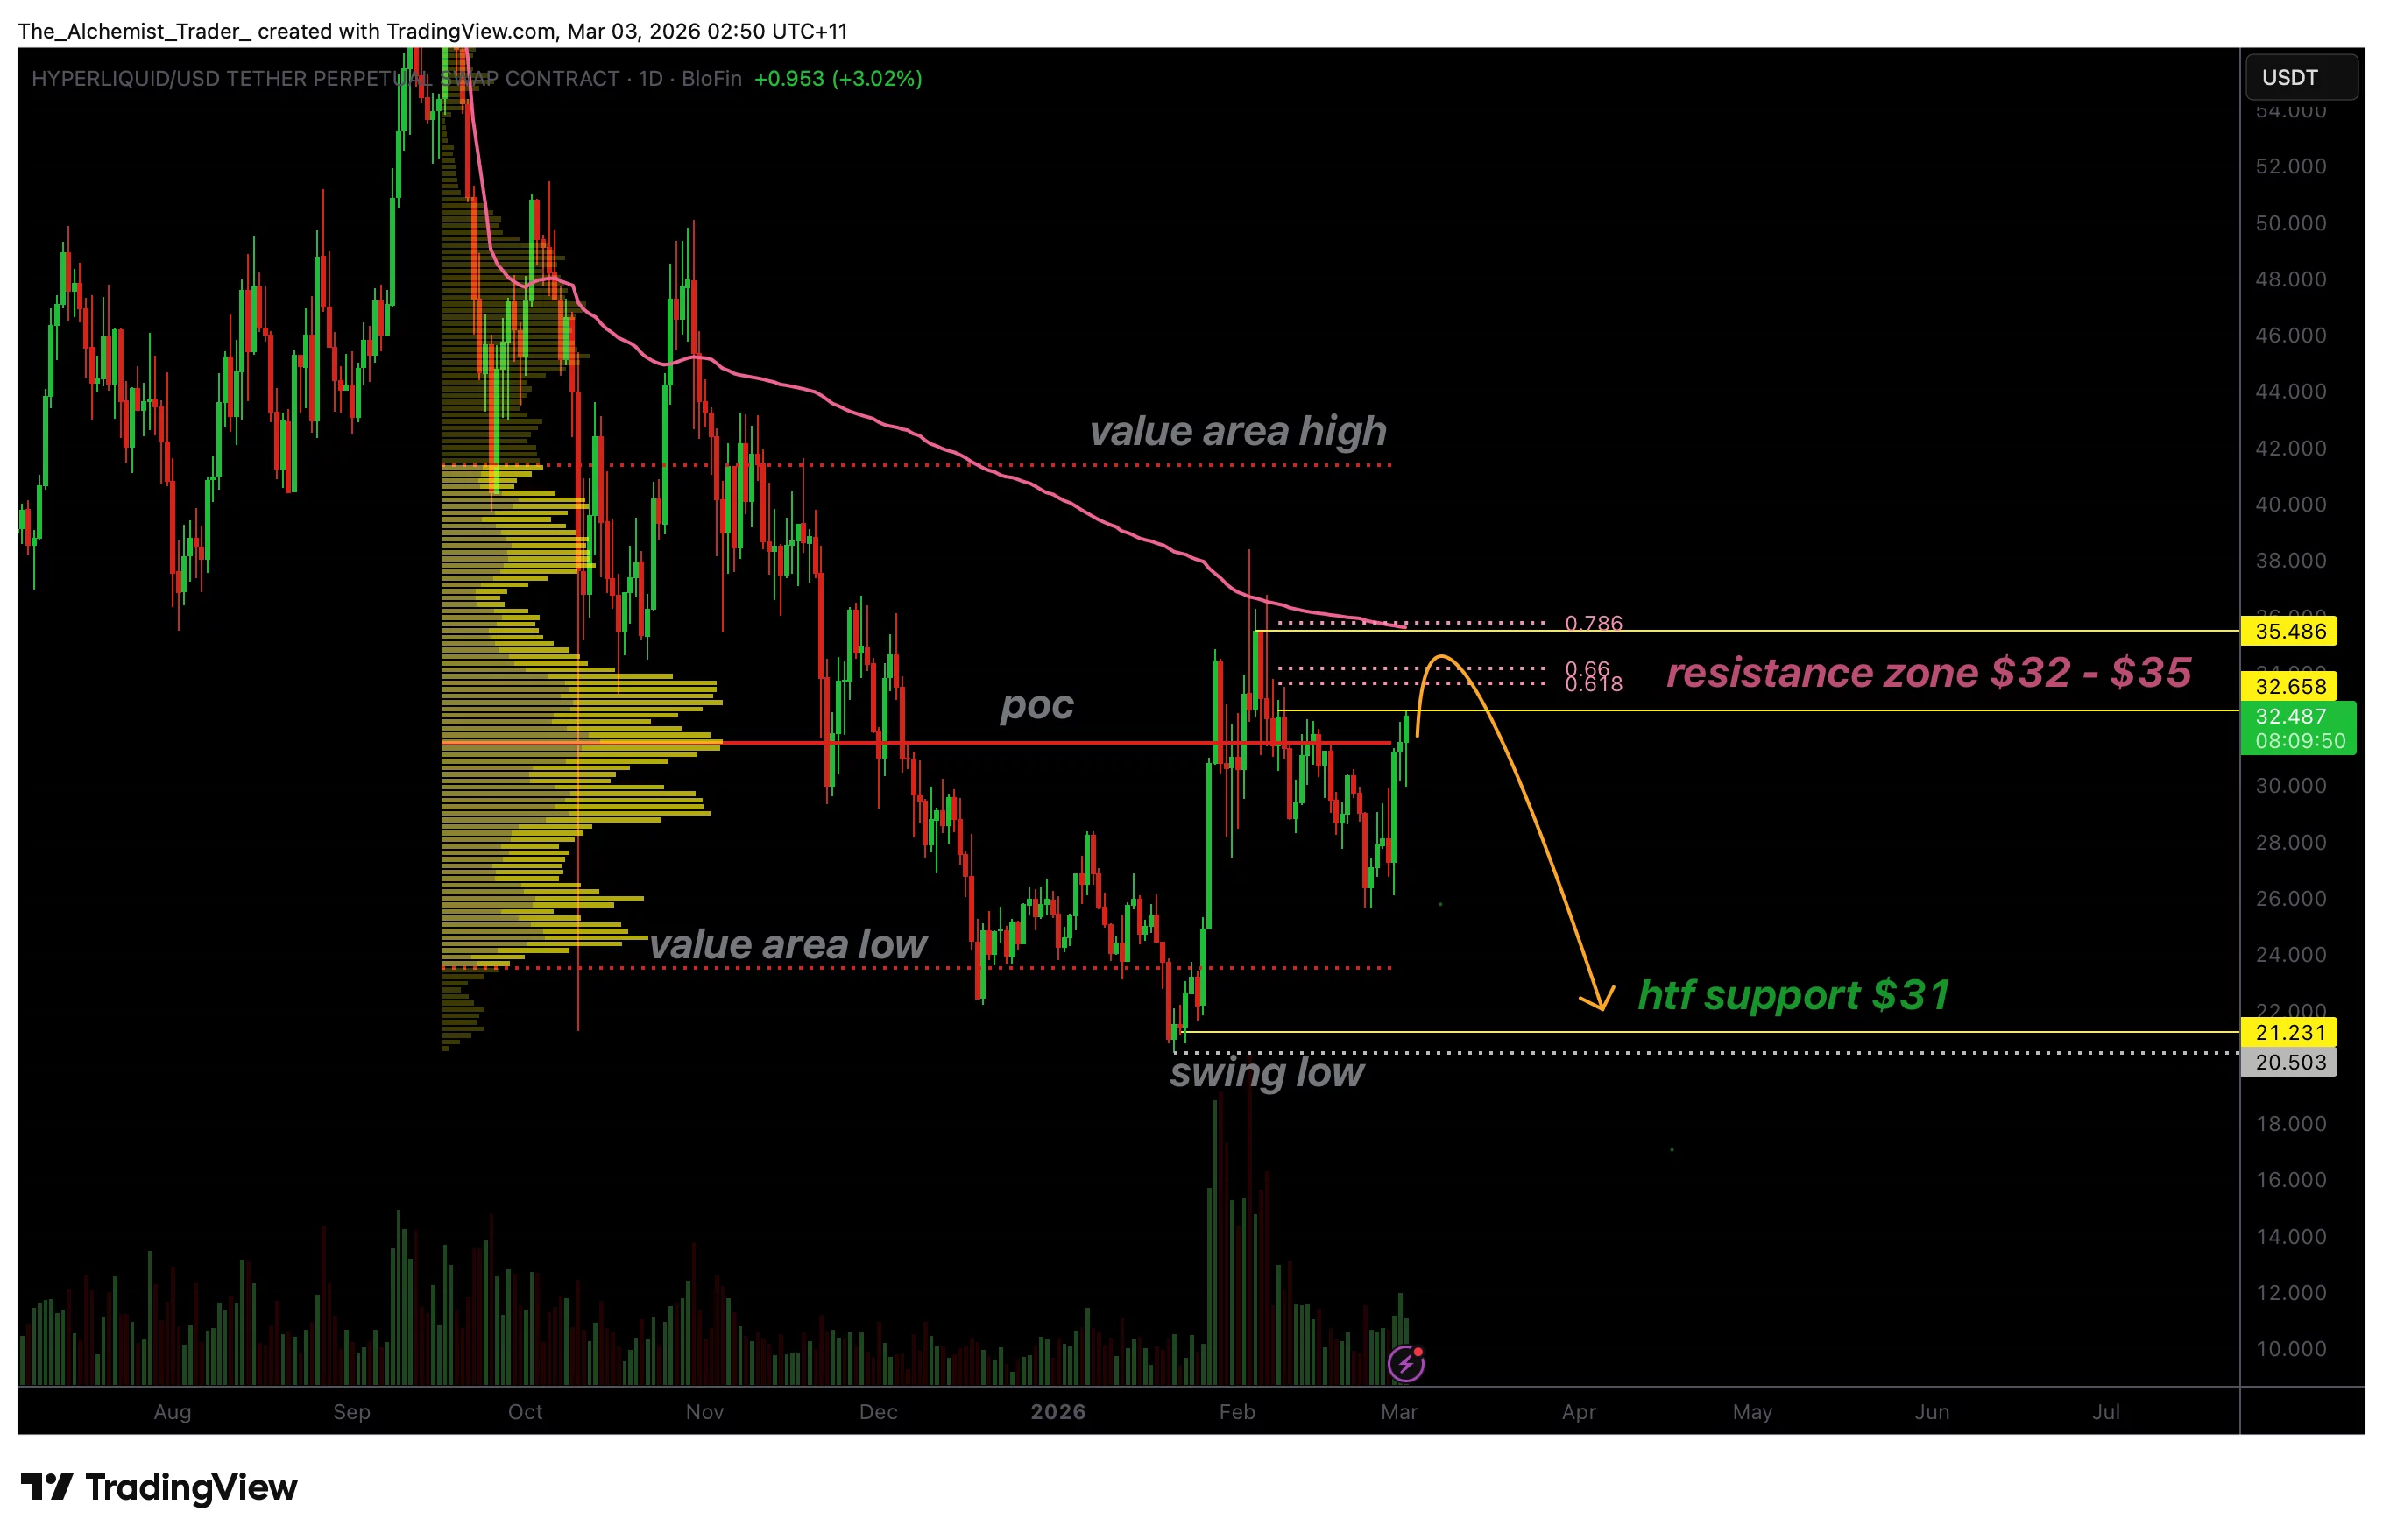
Hyperliquid price stalls at $32 resistance as declining volume signals weakness
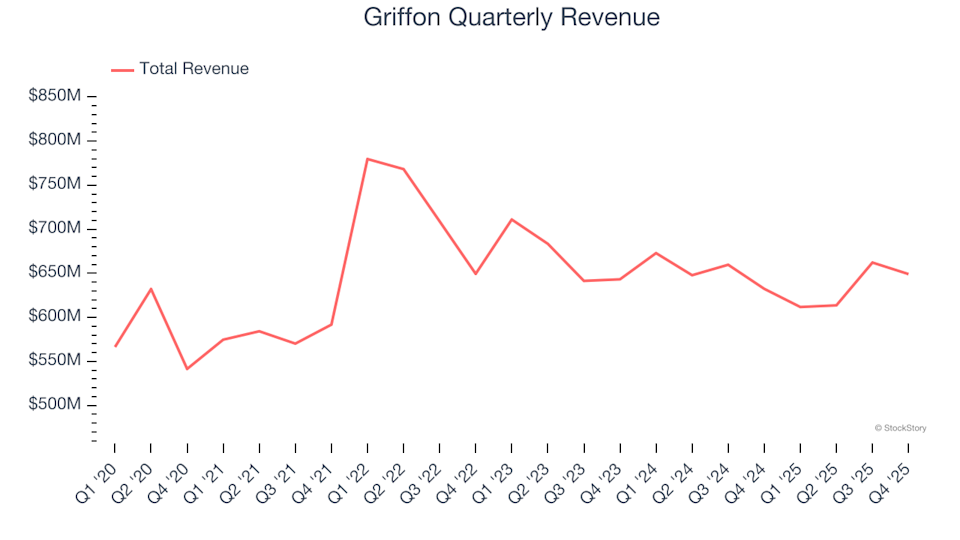
Griffon (GFF): Should You Buy, Sell, or Keep After Q4 Results?
What's Going On With AST SpaceMobile Stock Ahead Of Q4 Earnings?