Chart Industries: Does This Stock Represent a Direct Investment in AI-Driven Energy Demand?

Chart Industries: Acquisition Offer Drives Market Action
Chart Industries (GTLS) is currently influenced by a takeover proposal from Baker Hughes, who has put forward a cash offer of $210 per share. The stock is trading close to this figure, at $207.30, indicating that investors are largely confident the deal will go through. This narrow price difference suggests the market is treating the stock as a straightforward bet on the acquisition's completion.
However, recent trading activity shows that broader market sentiment is also shaping the stock's trajectory. The 52-week high stands at $208.24, just slightly above the current price and only 0.5% higher than the offer. This limited upside implies that the deal news has already been absorbed, with the stock essentially anchored to the expected $210 payout. Trading volume has been robust, with over a million shares exchanged daily recently, reflecting active speculation around the deal's outcome and other market influences.
Additional factors impacting the stock include widespread interest in AI-driven energy demand and the expansion of LNG trade. While the acquisition provides a clear short-term catalyst, these broader trends are also affecting price movements. Investors are balancing the certainty of the buyout with the ongoing narrative of energy infrastructure growth, particularly for data centers and global gas markets. At present, the $210 offer acts as a safety net, but the stock is caught between two major stories.
Viral Search Trends: The Rise of "AI Energy Demand"
Market participants are increasingly using search volume as a barometer for sentiment, and recent spikes in searches for 'AI energy demand' have made this theme central to energy infrastructure stocks. This trend is not just background chatter—it is actively influencing how companies like Chart Industries are valued. Over the past year, trading has reflected this sentiment, with the viral narrative helping to sustain a premium even as the $210 acquisition offer provides a solid foundation.
Strategy Backtest: Volatility Expansion Long-only
- Entry Criteria: Buy GTLS when ATR(14) exceeds its 60-day SMA and the price closes above the 20-day high.
- Exit Criteria: Sell when ATR(14) falls below its 60-day SMA, after 15 trading days, or when a 10% take-profit or 6% stop-loss is triggered.
Backtest Summary
- Strategy Return: -1.41%
- Annualized Return: 1%
- Maximum Drawdown: 26.8%
- Profit-Loss Ratio: 0.23
- Total Trades: 5
- Winning Trades: 4
- Losing Trades: 1
- Win Rate: 80%
- Average Hold Days: 14
- Max Consecutive Losses: 1
- Average Win Return: 5.09%
- Average Loss Return: 18.95%
- Max Single Return: 10.72%
- Max Single Loss Return: 18.95%
Trending Stocks and Price Movements
| Last Price ($) | Last Change (%) | Trend |
|---|---|---|
| 8.95 | 78.64% | Uptrend |
| 0.62 | 57.77% | Sideways |
| 84.23 | 56.88% | Sideways |
| 1.02 | 44.60% | Sideways |
| 0.77 | 43.90% | Sideways |
| 2.20 | 41.94% | Sideways |
| 5.87 | 41.45% | Uptrend |
| 1.49 | 36.70% | Uptrend |
| 35.68 | 36.13% | Sideways |
| 5.52 | 33.01% | Sideways |
Notable Tickers
- KORE Group Holdings
- Ensysce Biosciences (ENSC)
- Applied Optoelectronics (AAOI)
- OneMedNet (ONMD)
- INNEOVA Holdings (INEO)
- Edesa Biotech (EDSA)
- Chaince Digital (CD)
- Avalon Globocare (ALBT)
- Brand Engagement (BNAI)
- Battalion Oil (BATL)
Chart Industries’ main business, Cryo Tank Solutions, is closely tied to the global LNG market—a sector that has seen sustained growth and attention. The company’s recent achievements underscore this momentum: in the fourth quarter, Chart secured its first small-scale LNG solution for data centers, a direct result of the AI energy demand trend. U.S. LNG exports have soared from 0.5 Bcf/day in 2016 to 11.9 Bcf/day in 2024, reinforcing Chart’s long-term prospects and fueling ongoing search interest.
This creates a scenario with two key drivers: the acquisition headline offers a clear, short-term outcome, while the AI energy demand narrative provides a longer-term boost based on sentiment. With the stock trading near the $210 offer, the market appears to have already factored in the deal’s completion. Any further upside will depend on continued enthusiasm for the AI energy story, which could help offset any short-term earnings volatility.
Business Performance: Orders and Narrative
Investor optimism around Chart Industries is largely built on the viral AI energy narrative, but the company’s actual performance paints a more complex picture. Full-year results show strong demand, while quarterly figures reveal challenges in execution.
For the year, orders reached $5.68 billion, up 13.4%, and the backlog grew 21.5% to $5.89 billion, resulting in a book-to-bill ratio of 1.33. The company’s first small-scale LNG solution for data centers is a tangible outcome of the AI energy trend, fueling both search interest and the long-term narrative.
Quarterly results, however, show a different story. Fourth-quarter orders dropped 23.8% year-over-year, mainly due to tough comparisons with the previous year’s large LNG awards. Sales fell 2.5% to $1.08 billion, and the adjusted operating margin decreased to 19.1% in Q4, impacted by integration costs from the Howden acquisition.
In summary, Chart’s fundamentals support the long-term trend but face short-term challenges. The record backlog and data center LNG award validate the narrative, but translating these wins into steady quarterly sales and margins remains a work in progress. For a stock driven by headlines, viral sentiment provides a base, but quarterly results will determine if the stock can move higher.
Catalysts and Risks: What Comes Next?
Chart Industries’ future is shaped by two major forces: the certainty of the acquisition payout and the ongoing energy infrastructure narrative. The main catalyst is the expected closing of the Baker Hughes acquisition, anticipated in the second quarter of 2026, pending regulatory approval. Baker Hughes projects the deal will enhance growth, margins, earnings, and cash flow, with $325 million in annualized cost synergies expected within three years. This creates a binary event, with the $210 offer acting as a firm floor.
The primary risk is regulatory scrutiny. With a total enterprise value of $13.6 billion, the deal could face antitrust challenges, and any delays or required divestitures may introduce uncertainty and volatility.
Beyond the acquisition, the stock’s valuation is still tied to the viral AI energy demand theme. U.S. LNG exports have jumped from 0.5 Bcf/day in 2016 to 11.9 Bcf/day in 2024, supporting Chart’s long-term outlook. However, if market interest in AI energy demand wanes or LNG trade slows, the sentiment-driven premium could disappear, leaving the stock to trade solely on the deal’s completion.
Ultimately, Chart Industries faces dual catalysts and risks. The $210 offer provides a clear short-term floor, but its timing is uncertain. The AI energy narrative offers potential upside, but its volatility is a risk. For the stock to rise above the offer, investors must continue to see Chart as a major beneficiary of the energy infrastructure trend. Any setbacks in regulatory approval or a cooling of the narrative could quickly alter expectations.
Disclaimer: The content of this article solely reflects the author's opinion and does not represent the platform in any capacity. This article is not intended to serve as a reference for making investment decisions.
You may also like
Diamond Hill’s Fourth Quarter Success: Examining the Disparity Between Results and Expectations
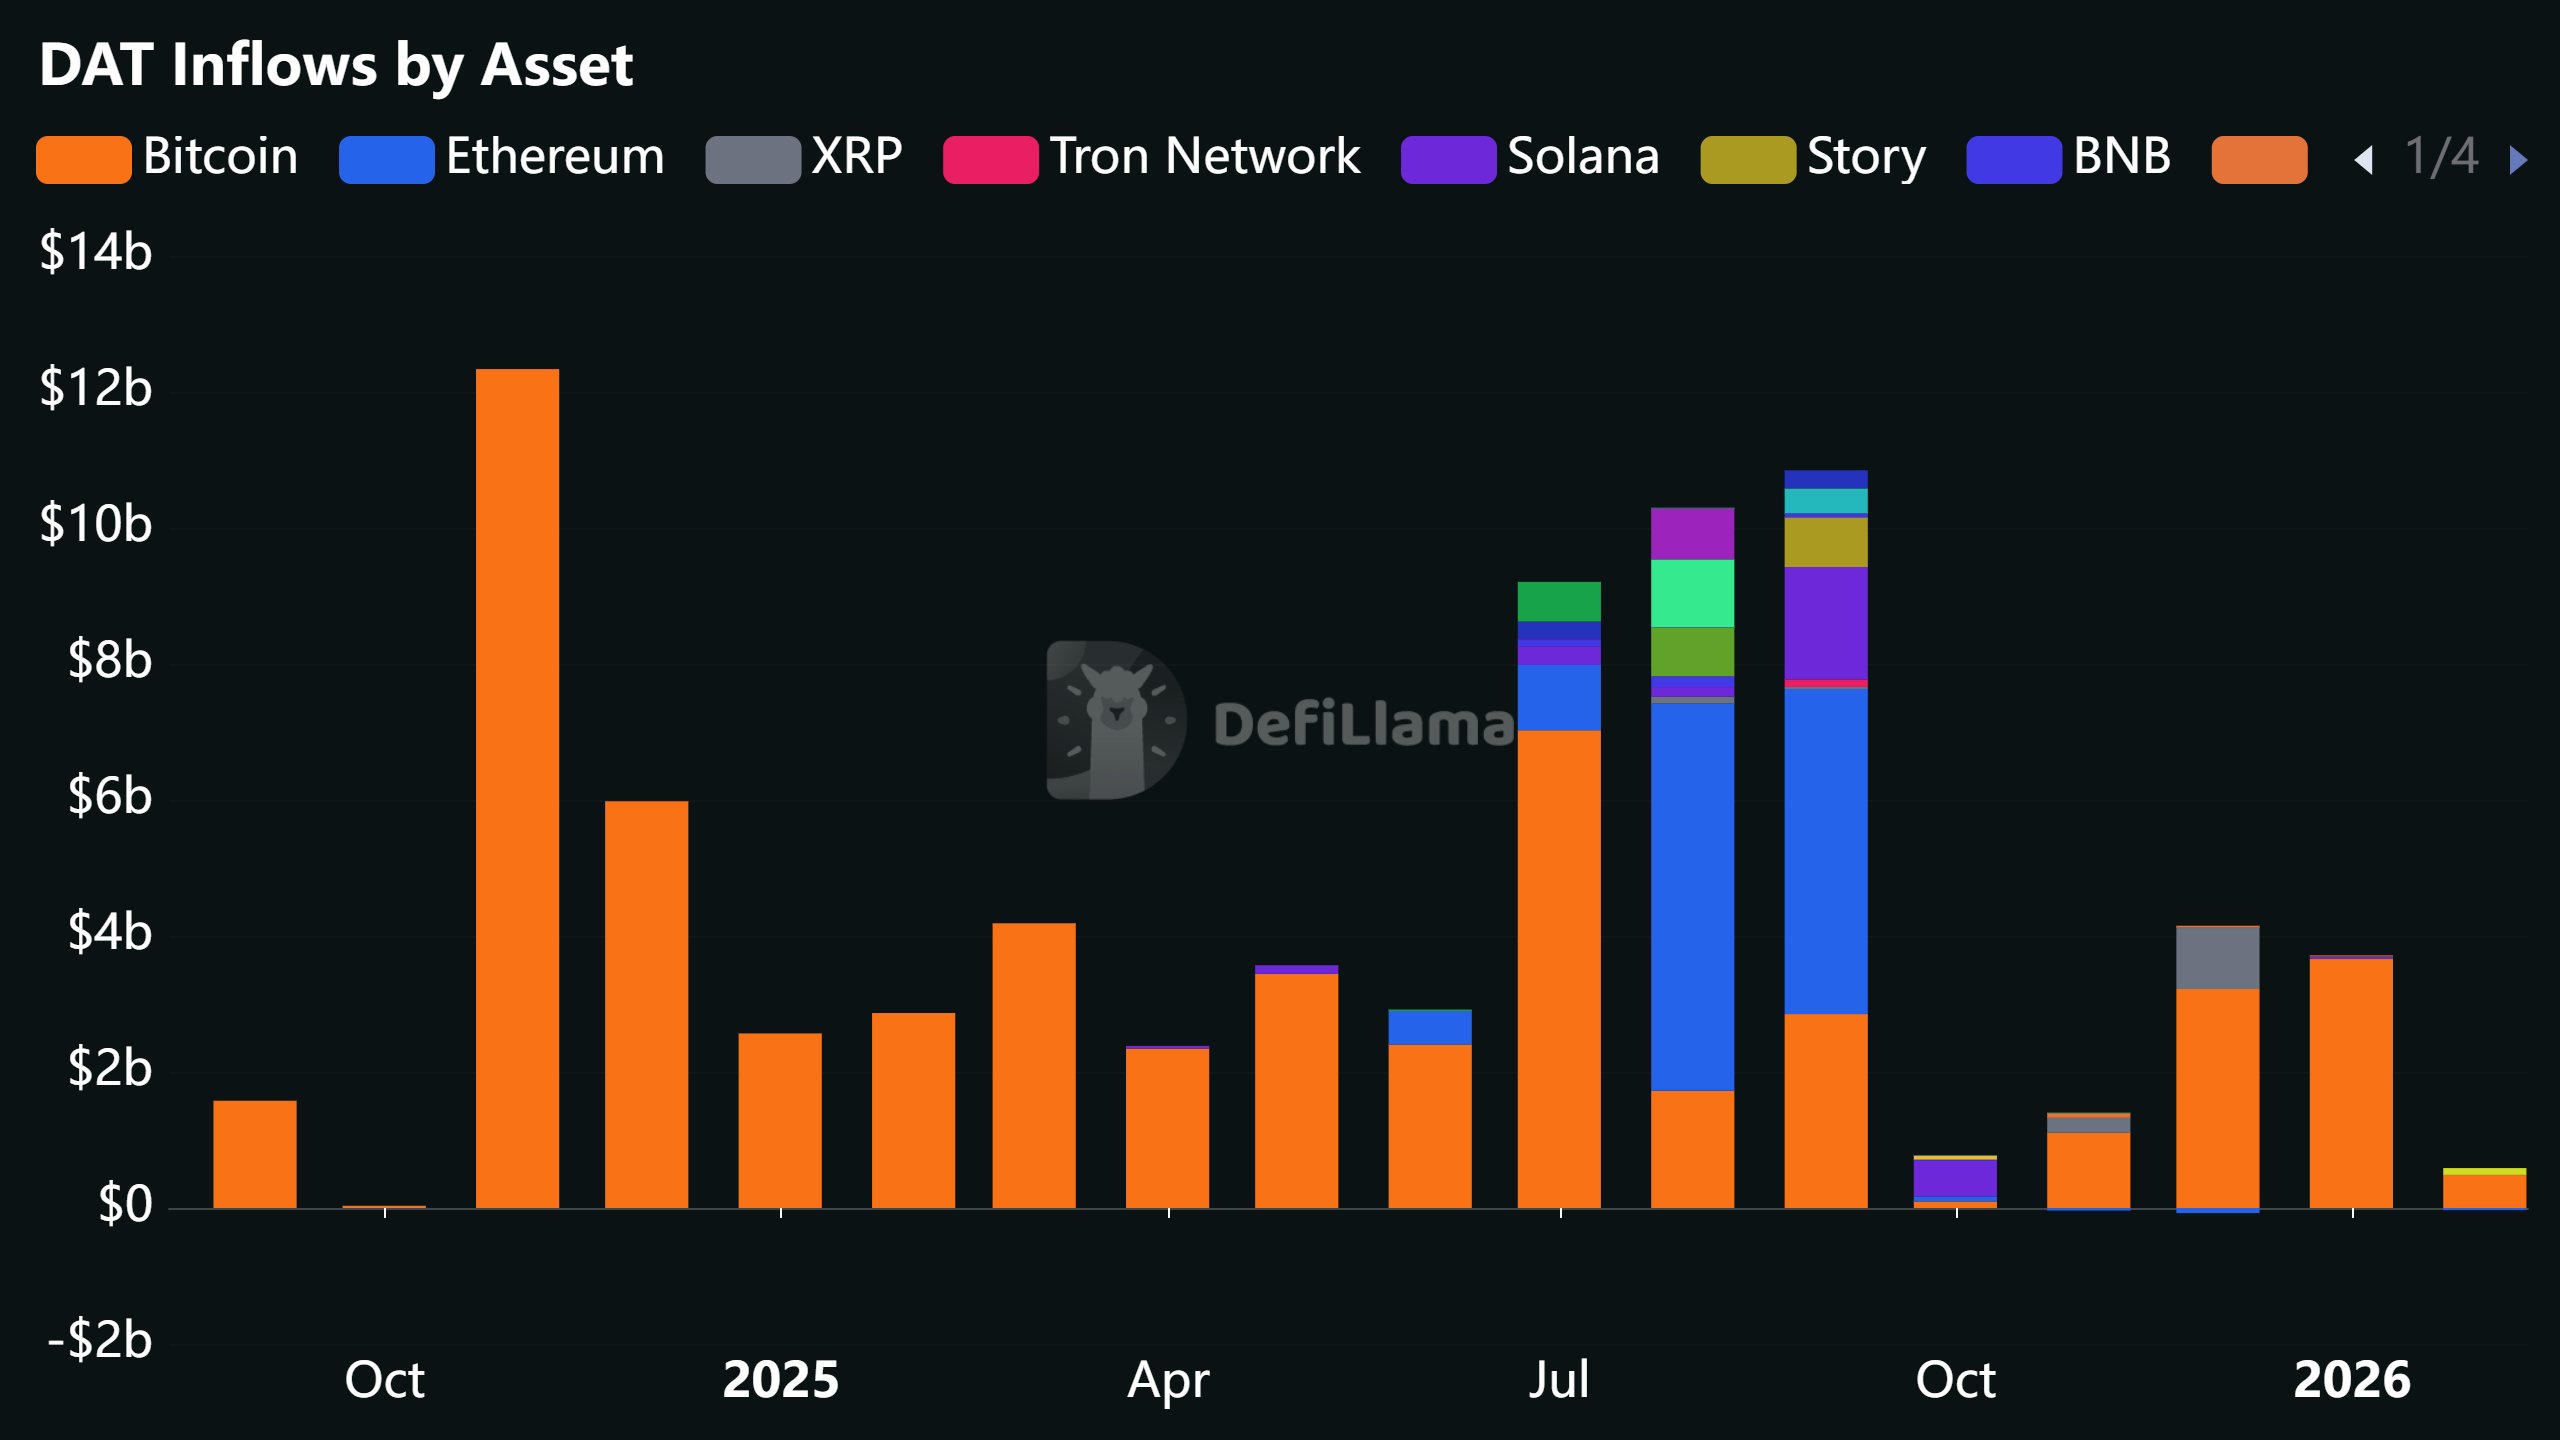
Crypto treasury inflows slow to the lowest since October 2024
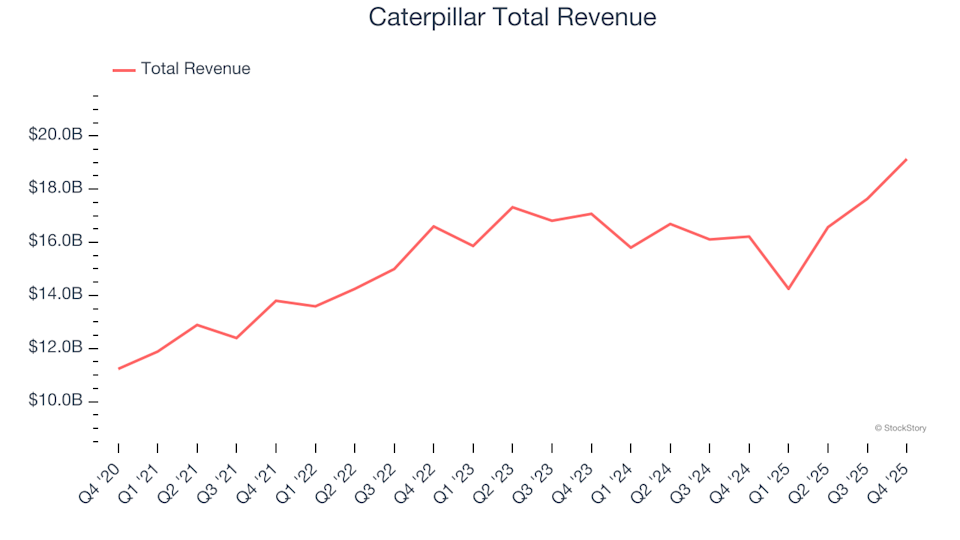
Heavy Machinery Stocks Q4 Analysis: Comparing Caterpillar (NYSE:CAT) With Its Competitors
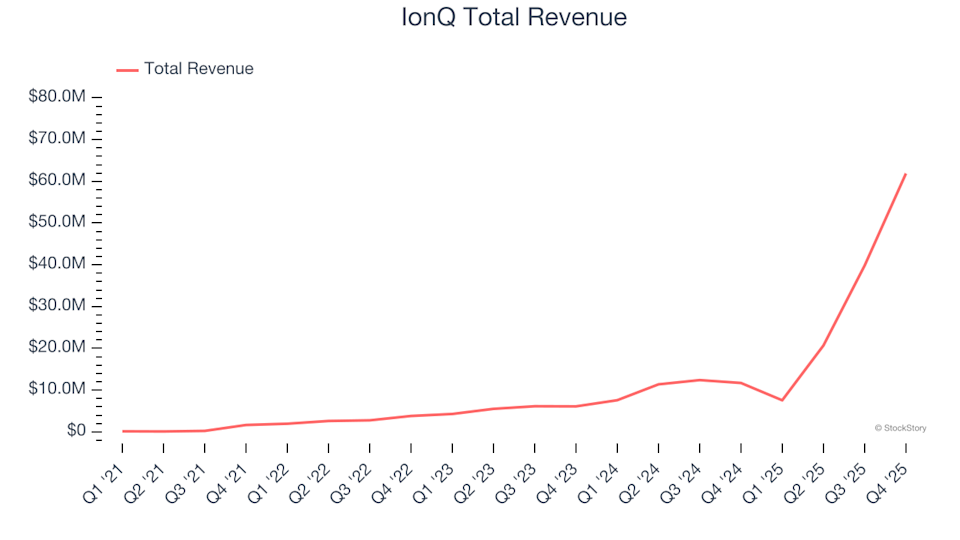
Reflecting on the fourth quarter earnings of hardware and infrastructure companies: IonQ (NYSE:IONQ)