
SUI Weekly Flow Review: Comparing RSI/MACD with Price Momentum

SUI ETF Debut on Nasdaq: Institutional Access Meets Market Headwinds
The introduction of 21Shares' spot SUI ETF on Nasdaq marks a significant step for institutional investors, offering a straightforward entry point for substantial capital into the Sui ecosystem. This development highlights increasing mainstream attention and formal investment interest. However, despite this positive milestone, the market is currently dominated by intense selling pressure that overshadows any immediate benefits from institutional participation.
Technical Outlook: Persistent Downtrend and Key Levels
Recent price movements reveal a clear downward trajectory, with a double-top pattern reinforcing a bearish market structure. The crucial resistance remains at $1.06, serving as both a horizontal barrier and the last major breakdown point. As long as SUI trades below this threshold, downward momentum is likely to persist, drawing focus to the support range between $0.85 and $0.77. For now, the prevailing technical setup outweighs the potential impact of the new ETF.
While institutional interest driven by the ETF is genuine, it has not yet generated enough buying power to counteract the ongoing sell-off. For the ETF to spark a meaningful bullish reversal, SUI must consistently close above the $1.06 resistance. Until that happens, the current downtrend is expected to continue, with the ETF serving as a possible catalyst for future, rather than immediate, recovery.
Price Action and Liquidity: Disconnected Flows
Market signals remain clear: selling pressure is overwhelming any new institutional inflows. SUI is currently priced at $0.8993, reflecting a nearly 4% decline over the past day. Daily trading volume stands at $5.46 million, suggesting that the decline is driven by steady, widespread selling rather than large, coordinated moves.
Long-Only Bollinger Bands (20,2) Strategy Overview
- Entry: Go long on SUI when the closing price moves above the upper Bollinger Band (20-period, 2 standard deviations).
- Exit: Close the position if the price falls below the lower band, after 10 trading days, or if a take-profit (+10%) or stop-loss (−6%) is triggered.
- Risk Controls: Take-profit set at 10%, stop-loss at 6%, and a maximum holding period of 10 days.
Technically, the bearish outlook remains intact. The $1.06 level continues to act as a significant resistance, with SUI trading well below it. The immediate support lies in the $0.85 to $0.77 range; a break below this could open the door to further declines toward $0.63. The weekly technical rating of "hold strong sell" reinforces the dominance of the current downtrend, with no signs of an imminent reversal.
There is a clear divergence between the narrative of new ETF and staking products and the actual flow of funds, which continues to exit the market. The subdued 24-hour volume points to a structural downtrend rather than a liquidity-driven event. Unless SUI can reclaim and hold above the $1.06 resistance, capital is likely to keep moving out, limiting the immediate impact of new institutional products.
Key Catalysts and Risks to Monitor
The main trigger for a potential reversal is a decisive break and daily close above the $1.06 resistance. Achieving this would disrupt the current pattern of lower highs and lower lows, signaling that selling pressure is easing. The first upside target would be $1.18, with the possibility of a rally toward the $1.40 to $1.50 range if momentum builds. However, this scenario requires strong and sustained price action.
The primary risk lies in a breakdown below the current support zone. If SUI fails to hold the $0.85 to $0.77 range, the next significant support is at $0.63, which would deepen the downtrend and increase downside risk. The weekly "hold strong sell" rating suggests that this bearish scenario remains the base case for now.
Close monitoring of 24-hour trading volume and price behavior is crucial for detecting shifts in market flow. The recent volume of $5.46 million and a 4% price drop highlight ongoing distributed selling. Watch for a sustained increase in volume alongside a close above $1.06 to confirm a bullish catalyst. Conversely, a sharp rise in volume on a break below $0.85 would indicate that the risk of further declines is materializing. These near-term signals will determine the direction of capital flows and the potential for a trend reversal.
Disclaimer: The content of this article solely reflects the author's opinion and does not represent the platform in any capacity. This article is not intended to serve as a reference for making investment decisions.
You may also like
Bitcoin ‘bull trap’ forming as bear market enters middle phase: Willy Woo
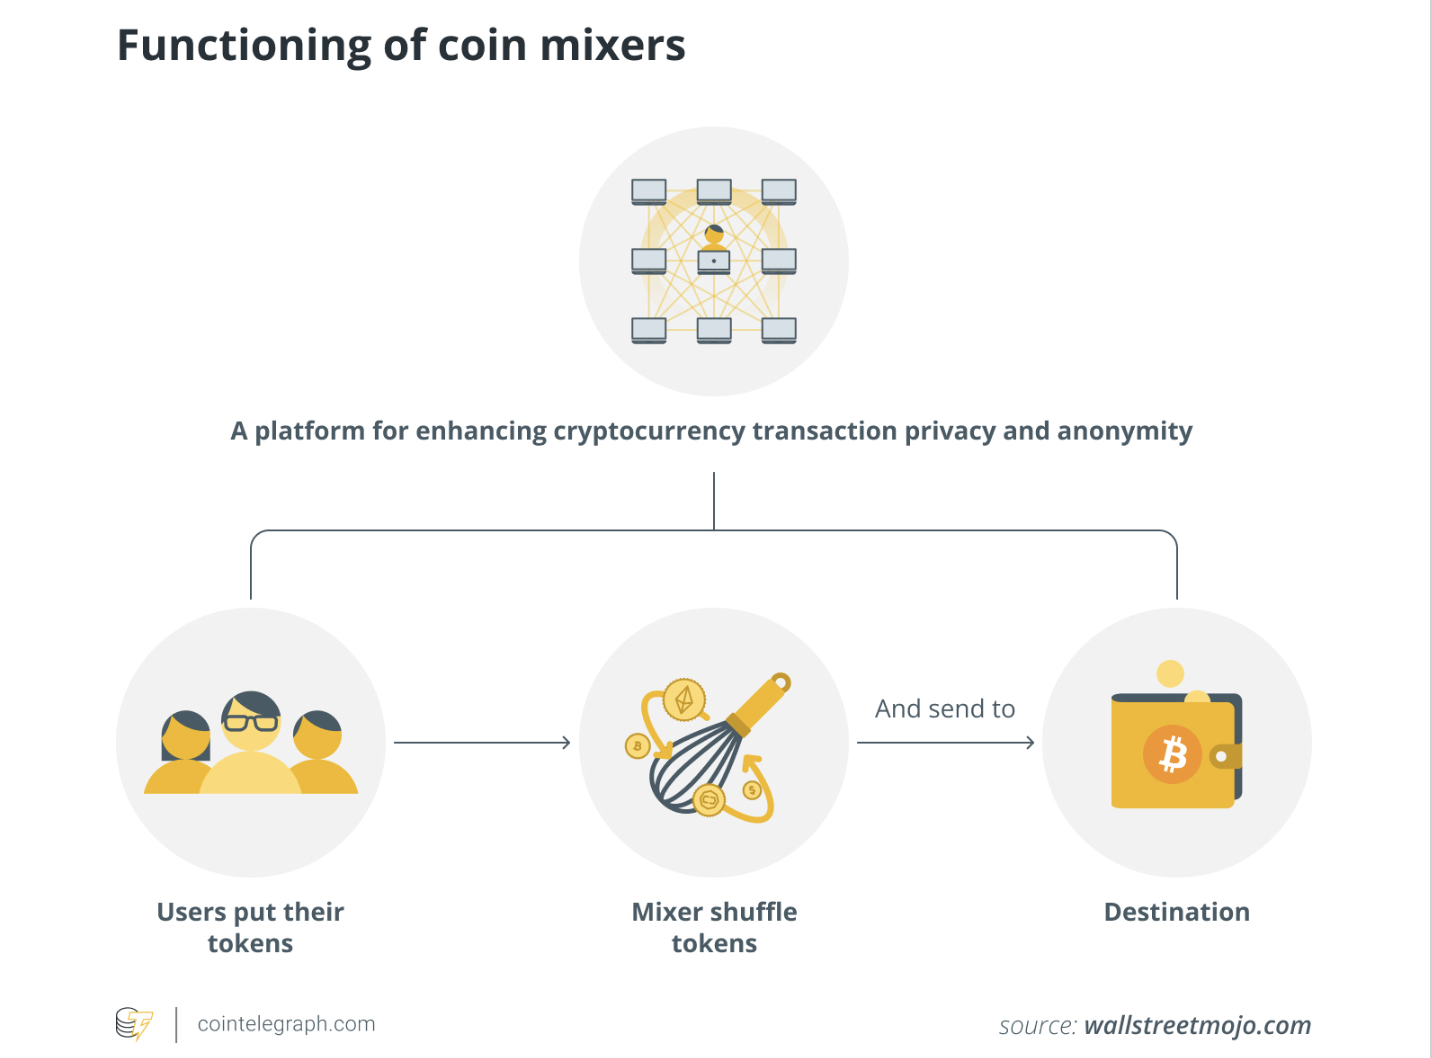
US Treasury report acknowledges legitimate uses of crypto mixers
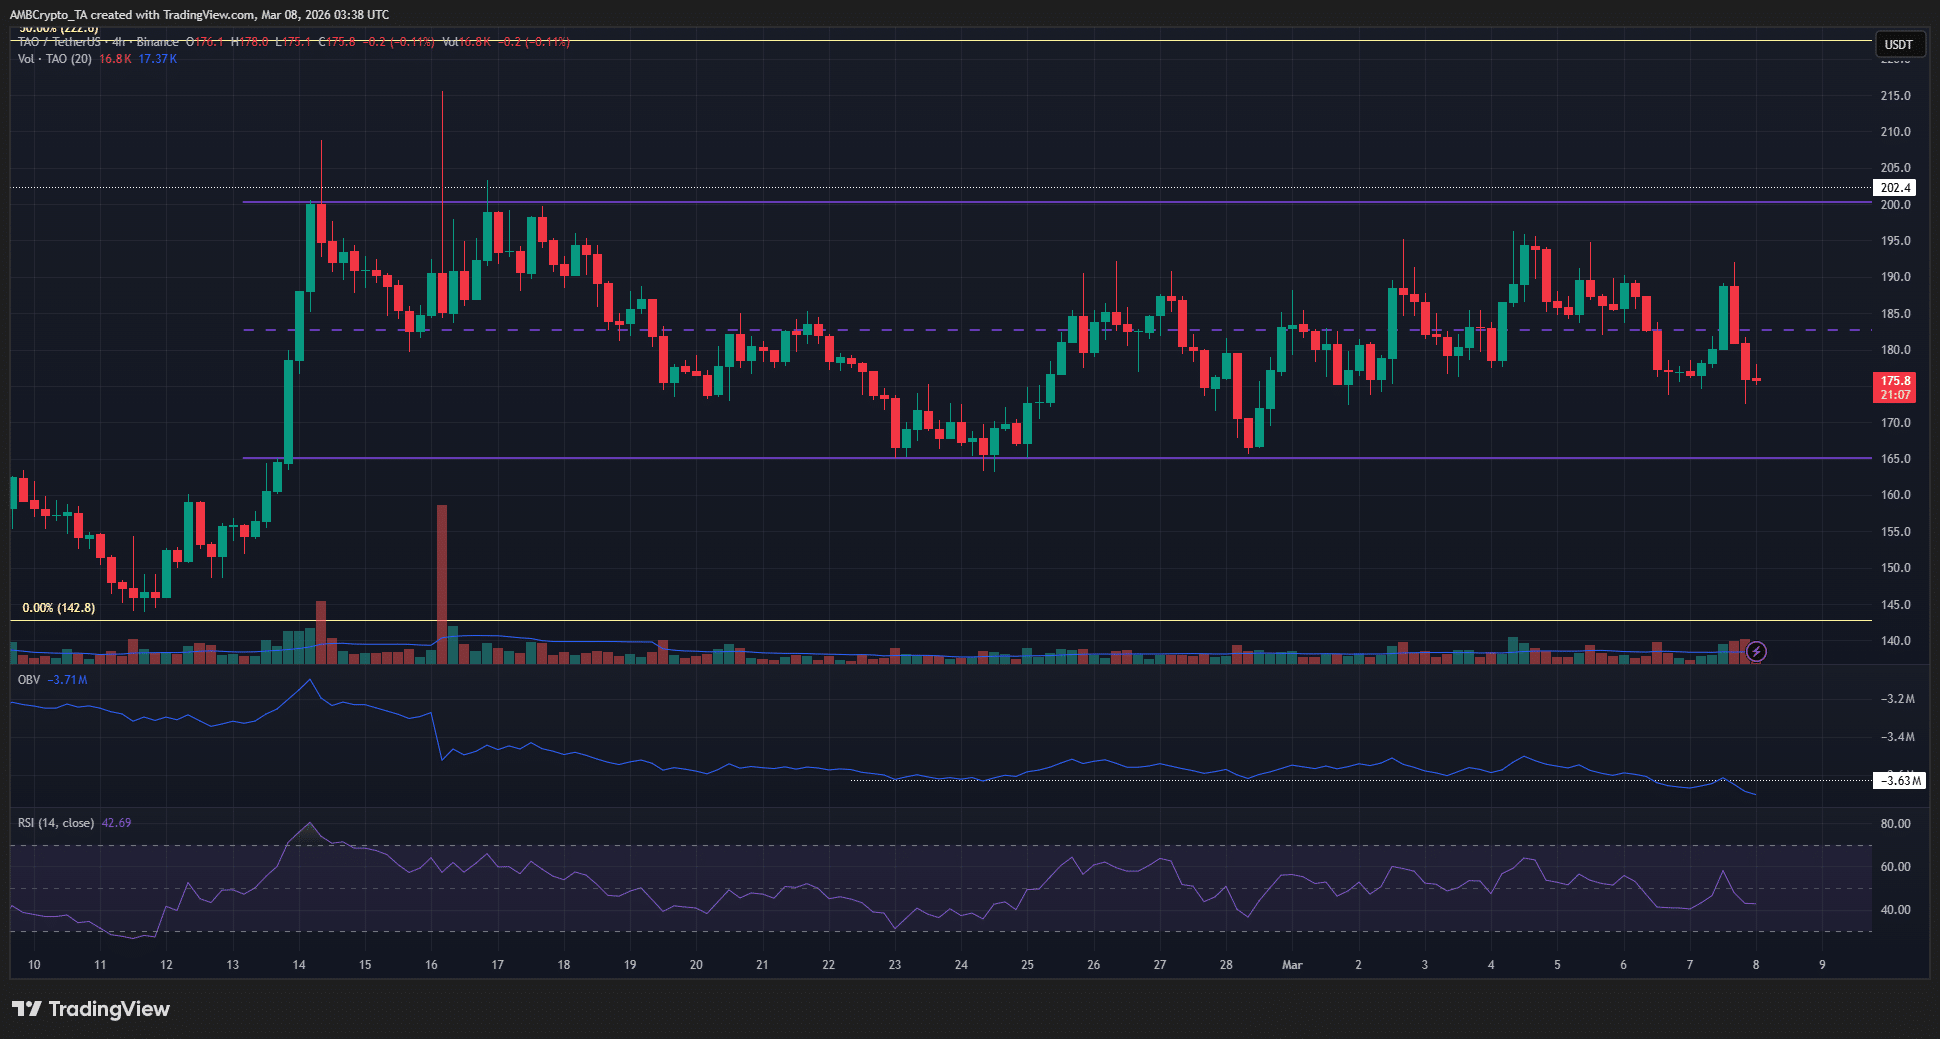
AI sector grows to $14.4B yet Bittensor fades – Will TAO revisit $165?
Paramount Gets Warner Bros. Discovery, but Netflix Comes Out a Winner