SPX6900 [SPX] has maintained a sustained bearish structure since late January, reflecting persistent distribution pressure across the market. The asset declined towards $0.2767 as sellers steadily dominated price action.
Initially, the trend weakened as lower highs began forming beneath key moving averages. At the same time, the 20 EMA near $0.3015 and the 50 EMA around $0.3059 started acting as dynamic resistance, limiting upside attempts.
The wider cryptocurrency decline spearheaded by Bitcoin [BTC] intensified risk aversion as this structure evolved, pushing traders to limit their exposure to high-volatility meme assets.
Shortly after, the price breached the horizontal support zone of $0.32, established between the 25th and 27th of February. This breakdown triggered faster selling, reinforcing the ongoing sequence of lower highs and lower lows.
Meanwhile, momentum indicators confirmed the pressure.
RSI fell below 30, approaching oversold territory while still lacking bullish divergence. MACD also remained negative, showing persistent bearish momentum.
As a result, rebound attempts stalled below the EMA cluster, leaving $0.2515 as the next structural support if selling pressure continues.
Is a relief bounce near, or will $0.27 finally break?
At press time, SPX6900 traded near 0.2757 under intense pressure as sellers drove the price toward the $0.2744 level. Initially, the decline accelerated after repeated failures near $0.30, where the $0.2989 level shifted from support to resistance.
As price slipped beneath that zone, bearish momentum expanded, and short-term traders began closing positions.
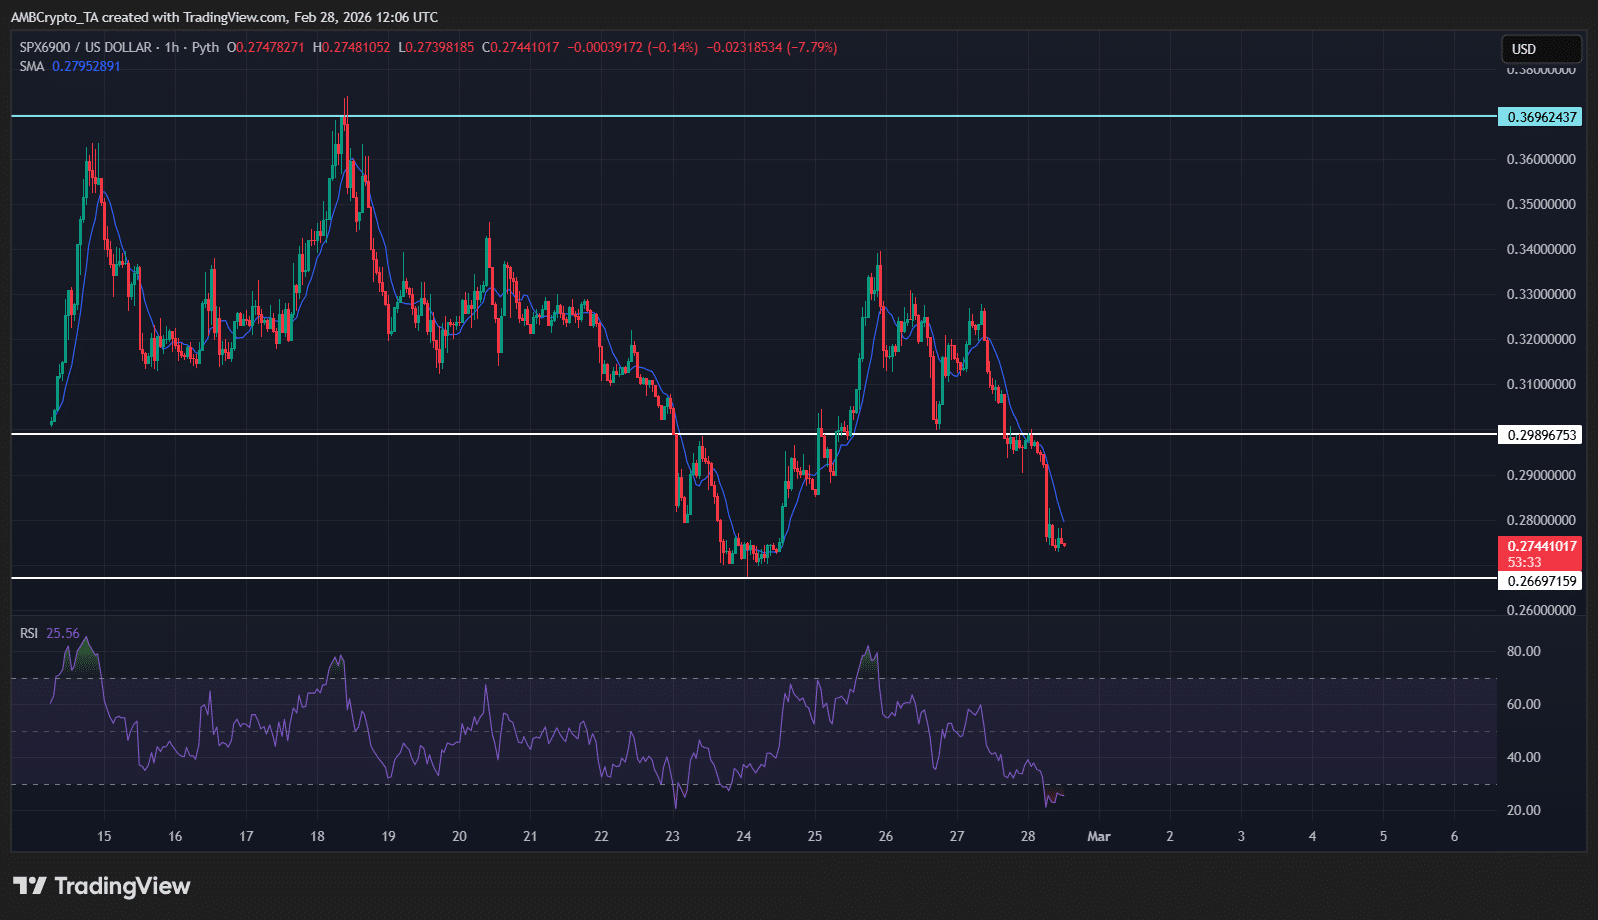
Source: TradingView
At the same time, momentum indicators reflect exhaustion rather than renewed panic. The RSI has fallen to 25.56, placing the asset deep in oversold territory.
Such conditions often attract opportunistic buyers searching for mean reversion opportunities.
In that context, price may attempt a relief rebound toward the $0.2795 SMA first, followed by a retest of the $0.2989 resistance band.
However, the broader structure still favors sellers, as the sequence of lower highs remains intact. Price previously failed near $0.33 and continues trending beneath major resistance at $0.3696.
Therefore, if buyers cannot defend the $0.27 region, the next structural downside target emerges near $0.2669, where stronger long-term demand may appear.
Final Summary
- SPX6900 [SPX] remains locked in a sustained downtrend after a 55% decline in the last 90 days, with persistent lower highs and resistance at key EMA levels keeping recovery attempts capped.
- SPX6900 oversold momentum may trigger a short-term rebound toward $0.2795–$0.2989, yet failure to defend the $0.27 support zone could expose the token to further downside.