When will the US ISM Manufacturing PMI be released and what impact might it have on EUR/USD?

Preview of US ISM Manufacturing PMI Data
The Institute for Supply Management (ISM) in the United States is set to publish its Manufacturing Purchasing Managers’ Index (PMI) for February today at 15:00 GMT.
Analysts anticipate that the latest ISM report will indicate continued, albeit slower, growth in the manufacturing sector. The PMI is projected to register at 51.8, a slight decrease from January’s 52.6. Last month marked the first time in nearly a year that the index climbed above the 50.0 threshold, which distinguishes expansion from contraction in the sector.
In addition to the headline PMI, market participants will pay close attention to key sub-indices, including the Employment Index, Prices Paid, and New Orders Index. The Prices Paid component—which tracks changes in costs for inputs like labor and materials—is forecast to rise to 59.5, up from the previous 59.0 reading.
If the ISM Manufacturing PMI falls short of expectations, it could fuel speculation that the Federal Reserve may consider lowering interest rates, as policymakers remain cautious about the economic outlook. Conversely, stronger-than-expected data would likely reduce the chances of rate cuts.
Potential Impact of US PMI Figures on EUR/USD
At the time of writing, the EUR/USD pair is trading approximately 0.75% lower, near the 1.1730 mark. The short-term outlook has turned slightly negative, with the pair slipping beneath its 20-day Exponential Moving Average, which is situated around 1.1800.
The 14-day Relative Strength Index (RSI) has dropped closer to 40.00 after failing to reclaim the 60.00 level, signaling increased selling pressure at higher price points. A move below 40.00 on the RSI could trigger additional downward momentum.
Immediate support is identified near the trend-line break around 1.1645. Should this level give way, the next targets would be the mid-1.15 range and the 1.1489 level, which marked the start of the recent uptrend. On the resistance side, the 20-day EMA at 1.1800 is the first hurdle, followed by recent highs at 1.1880 and the 1.2030 peak. Overcoming these would be necessary to reverse the current corrective trend and restore a broader bullish outlook.
(This technical analysis was generated with the assistance of AI tools.)
Disclaimer: The content of this article solely reflects the author's opinion and does not represent the platform in any capacity. This article is not intended to serve as a reference for making investment decisions.
You may also like
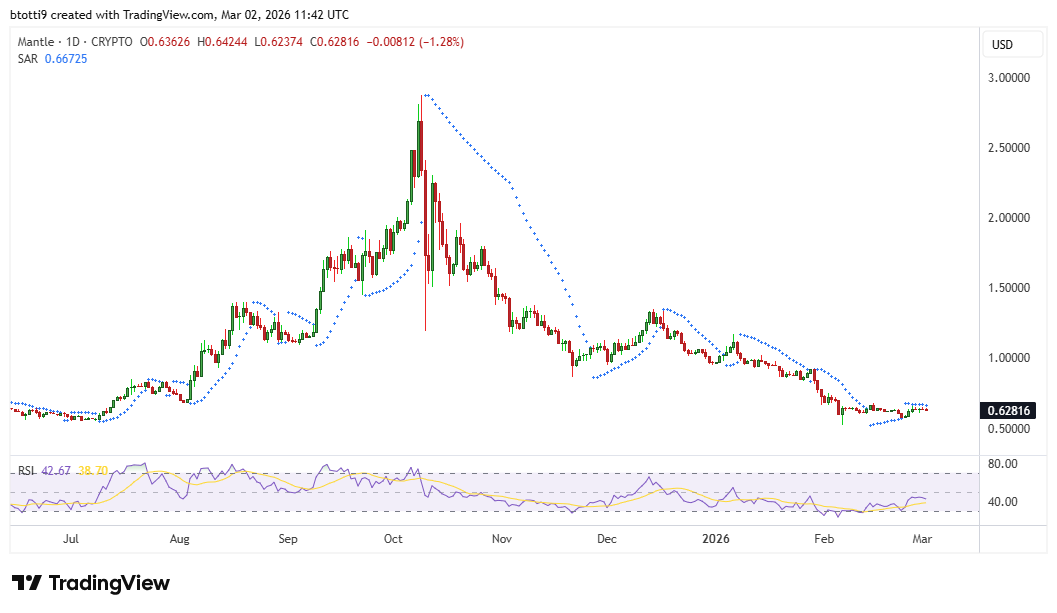
Mantle hits $1B market size milestone on Aave: will MNT price explode next?
Block Street Launches BSB Token to Bridge Crypto Infrastructure Gaps
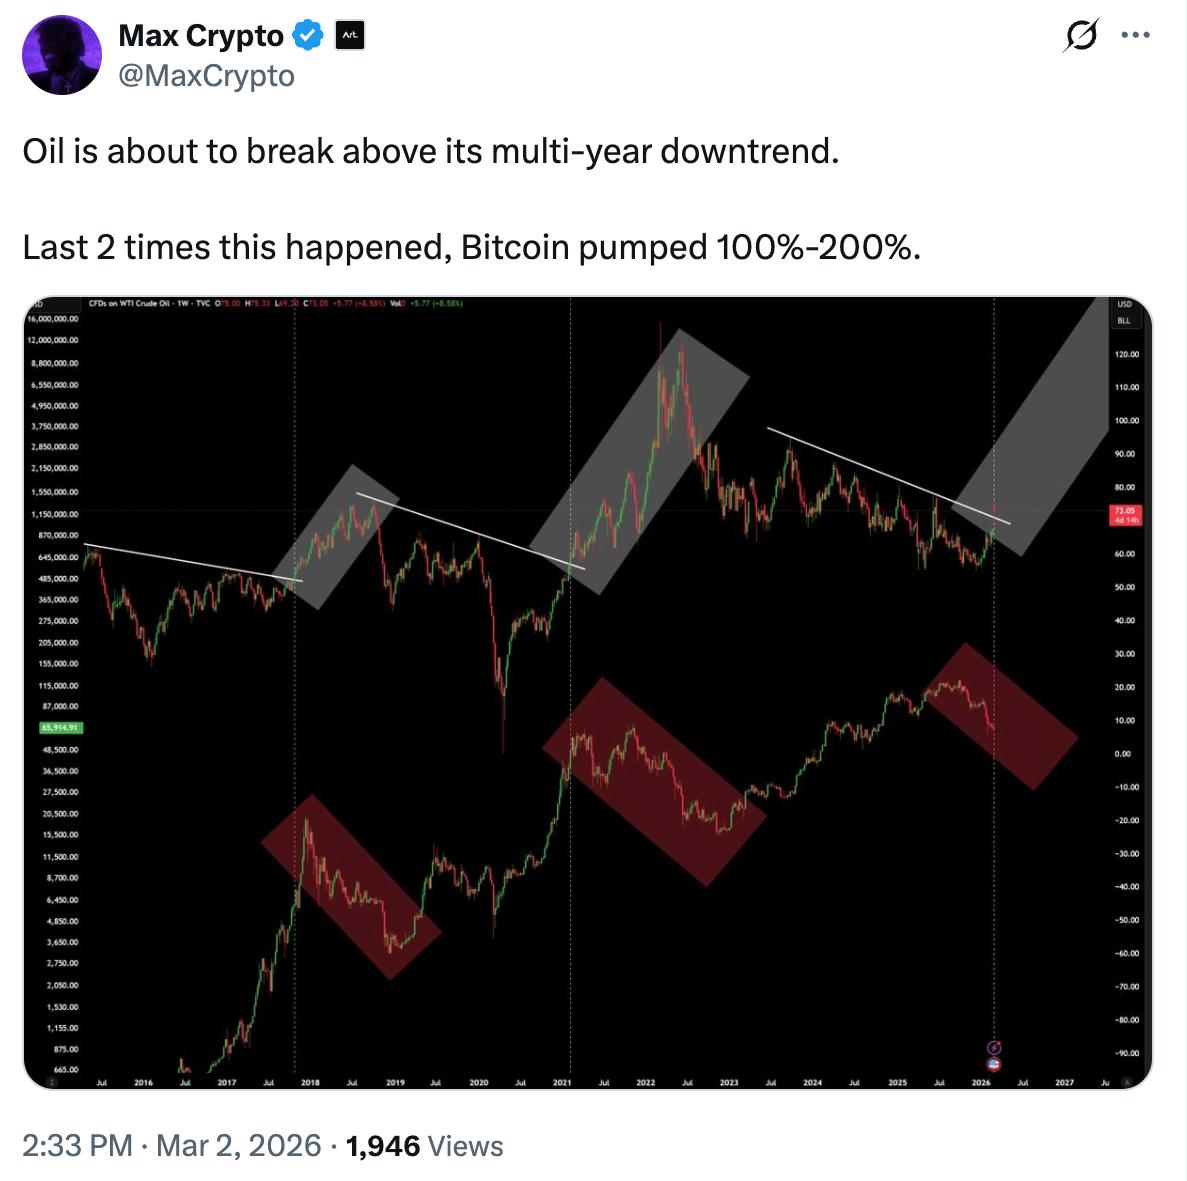
Will Bitcoin crash if oil prices hit $100 per barrel?