
Elliot Wave Theory Says Bitcoin Price Is Headed To $40,000, But The End Game Will Shock You

By:Newsbtc
A technical analyst known as ‘V’ has shared a striking Elliott Wave Theory-based Bitcoin price outlook on X that he believes most market participants are completely overlooking. The chart, plotted on Bitcoin’s weekly timeframe, outlines a multi-year roadmap that could first subject the cryptocurrency to significant downside pressure, potentially triggering a price crash to $40,000 before setting the stage for an explosive rally that could shock investors and traders.
Elliott Wave Pattern Points to $40,000 Bitcoin Price Dip
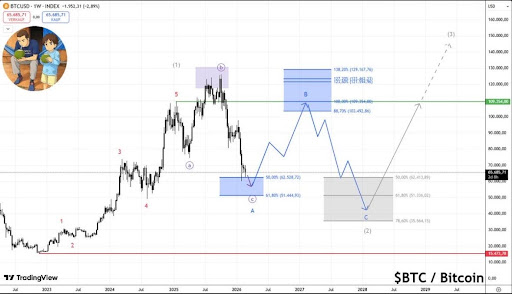
V’s analysis on X begins by identifying a completed five-wave structure that carried Bitcoin from its 2022 lows to an early 2025 peak around $109,354. Those waves, clearly labeled 1 through 5 on the chart, mark the end of Bitcoin’s first major impulse move.
From here, V projects that Bitcoin could now enter a Wave 2 correction, which could take the form of a classic ABC zigzag pattern. In this projected scenario, Wave A is forecasted to bottom somewhere between the 50% and 61.8% Fibonacci retracement levels, triggering a Bitcoin price decline to the $51,000 to $62,000 range.
var rnd = window.rnd || Math.floor(Math.random()*10e6); var pid607465 = window.pid607465 || rnd; var plc607465 = window.plc607465 || 0; var abkw = window.abkw || ''; var absrc = 'https://servedbyadbutler.com/adserve/;ID=172179;size=0x0;setID=607465;type=js;sw='+screen.width+';sh='+screen.height+';spr='+window.devicePixelRatio+';kw='+abkw+';pid='+pid607465+';place='+(plc607465++)+';rnd='+rnd+';click=CLICK_MACRO_PLACEHOLDER'; document.write('
');
if (!window.AdButler){(function(){var s = document.createElement("script"); s.async = true; s.type = "text/javascript";s.src = "https://servedbyadbutler.com/app.js";var n = document.getElementsByTagName("script")[0]; n.parentNode.insertBefore(s, n);}());}
var AdButler = AdButler || {}; AdButler.ads = AdButler.ads || []; var abkw = window.abkw || ""; var plc366606 = window.plc366606 || 0; (function(){ var divs = document.querySelectorAll(".plc366606:not([id])"); var div = divs[divs.length-1]; div.id = "placement_366606_"+plc366606; AdButler.ads.push({handler: function(opt){ AdButler.register(172179, 366606, [728,90], "placement_366606_"+opt.place, opt); }, opt: { place: plc366606++, keywords: abkw, domain: "servedbyadbutler.com", click:"CLICK_MACRO_PLACEHOLDER" }}); })();
 Source:
Chart from V on X
Source:
Chart from V on X
Following this, Wave B is expected to see a small relief bounce, pushing Bitcoin back up toward the 100% to 132% extension zone between $109,354 to $120,594 on the chart. Once this bounce occurs, V predicts a final downside target in Wave C. He forecasts that the Bitcoin price could decline to the $51,336 to $35,564 range, representing a massive 55% to 69% decrease from the previous bounce area.
Notably, V has stated that Bitcoin’s projected move to its final bearish target could catch the majority of investors and traders completely off guard. This is because a relief rally back towards six figures in Wave B would likely restore investor confidence and draw buyers back in, only for the market to decline all over again to an even steeper target. In other words, it could be a bull trap.
The Bitcoin End Game That Could Shock Investors
Following the anticipated completion of the Wave 2 correction, V predicts the onset of Wave 3, a phase that could trigger a powerful bullish reversal for Bitcoin. The chart illustrates a projected rally, highlighted by a rising arrow. Bitcoin is expected to retest and reclaim its previous resistance level around $109,354, marking a potential gain of more than 207% from its projected Wave C bottom around $35,564.
var rnd = window.rnd || Math.floor(Math.random()*10e6); var pid607472 = window.pid607472 || rnd; var plc607472 = window.plc607472 || 0; var abkw = window.abkw || ''; var absrc = 'https://servedbyadbutler.com/adserve/;ID=172179;size=0x0;setID=607472;type=js;sw='+screen.width+';sh='+screen.height+';spr='+window.devicePixelRatio+';kw='+abkw+';pid='+pid607472+';place='+(plc607472++)+';rnd='+rnd+';click=CLICK_MACRO_PLACEHOLDER'; document.write('
');
if (!window.AdButler){(function(){var s = document.createElement("script"); s.async = true; s.type = "text/javascript";s.src = "https://servedbyadbutler.com/app.js";var n = document.getElementsByTagName("script")[0]; n.parentNode.insertBefore(s, n);}());}
var AdButler = AdButler || {}; AdButler.ads = AdButler.ads || []; var abkw = window.abkw || ""; var plc452518 = window.plc452518 || 0; (function(){ var divs = document.querySelectorAll(".plc452518:not([id])"); var div = divs[divs.length-1]; div.id = "placement_452518_"+plc452518; AdButler.ads.push({handler: function(opt){ AdButler.register(172179, 452518, [728,90], "placement_452518_"+opt.place, opt); }, opt: { place: plc452518++, keywords: abkw, domain: "servedbyadbutler.com", click:"CLICK_MACRO_PLACEHOLDER" }}); })();

Blood Moon Affecting Bitcoin Price? Why A Surge Above $100,000 Could Be Coming
Once BTC crosses this resistance with strong momentum, the chart projects a stronger upward push toward a shocking $150,000 target. Notably, the last time Bitcoin was remotely close to this level was in October 2025, when its price skyrocketed to new all-time highs above $126,000. If the V’s Elliott Wave forecast plays out as expected, it would mark a new historic ATH for BTC.
 BTC trading at $67,056 on the 1D chart | Source: BTCUSDT on
Tradingview.com
BTC trading at $67,056 on the 1D chart | Source: BTCUSDT on
Tradingview.com
0
0
Disclaimer: The content of this article solely reflects the author's opinion and does not represent the platform in any capacity. This article is not intended to serve as a reference for making investment decisions.
PoolX: Earn new token airdrops
Lock your assets and earn 10%+ APR
Lock now!
You may also like
Plug Power: Fourth Quarter Earnings Overview
101 finance•2026/03/03 16:51
Shareholder-Friendly Moves & Fleet-Upgrade Efforts Aid SkyWest
Finviz•2026/03/03 16:51
Cardano (ADA) price dips below $0.27 as Hoskinson calls CLARITY act a ‘horrific’ bill
Coinjournal•2026/03/03 16:51

ECB: Nomura says energy shock prompts policy to remain unchanged
101 finance•2026/03/03 16:48
Trending news
MoreCrypto prices
MoreBitcoin
BTC
$68,243.09
-2.04%
Ethereum
ETH
$1,984.08
-3.93%
Tether USDt
USDT
$1
-0.02%
BNB
BNB
$634.39
-2.40%
XRP
XRP
$1.37
-2.84%
USDC
USDC
$1
+0.00%
Solana
SOL
$85.53
-4.32%
TRON
TRX
$0.2806
-0.72%
Dogecoin
DOGE
$0.09103
-5.75%
Cardano
ADA
$0.2684
-6.00%
How to buy BTC
Bitget lists BTC – Buy or sell BTC quickly on Bitget!
Trade now
Become a trader now?A welcome pack worth 6200 USDT for new users!
Sign up now