
Gold’s $5,000 Milestone: Is It a Momentum Shift or Just a Normal Correction?

Gold's Rally Faces a Dramatic Reversal
Gold's impressive surge came to an abrupt halt, plunging more than 7% and slipping below the $5,000 threshold on Friday—marking its steepest single-day loss in several weeks. This sharp decline followed a two-day, 10% drop after the metal reached an all-time high last week, with intensified selling as stop-loss orders were triggered. The immediate spark for this downturn was speculation about a more hawkish Federal Reserve chair, which strengthened the U.S. dollar after the appointment announcement.
Despite this significant setback, gold is still poised to finish the month with gains exceeding 15%, on track for its strongest monthly performance since 1999. The recent volatility reflects a classic scenario of investors locking in profits after a rapid ascent, with technical factors amplifying the selloff. This phase appears to be a healthy consolidation after a steep rally, while the overall bullish trend remains intact.
The downturn wasn't limited to gold alone. Other precious metals experienced substantial losses as well—silver tumbled by 14.1%, while platinum and palladium also suffered notable declines. This widespread weakness highlights a shift toward risk aversion in the market, fueled by expectations of a hawkish Fed and a stronger dollar, which makes gold more expensive for international buyers.
Contradictory Signals: Record Investment Flows Amid Price Slump
One of the most remarkable developments is the surge in capital flowing into gold, even as prices retreat. In January, global gold ETFs attracted a record inflow, pushing total assets to a new peak of $669 billion. This trend persisted into early February, with investors increasing their holdings even as gold dropped over 7% on Friday. These inflows indicate that institutional buyers are actively absorbing the selling pressure, creating a notable disconnect between price action and investment flows.
This wave of buying is widespread and appears to be driven by structural factors. North American and Asian investors led the charge, with Asian funds recording their strongest month ever. These inflows are part of an eight-month streak, and both precious metals and gold mining ETFs saw a record $91.86 billion in cumulative inflows last year. Analysts attribute this sustained demand to solid fundamentals, such as central bank purchases, rather than speculative trading.
In summary, the recent price drop appears to be driven by technical factors and shifting sentiment, rather than a decline in underlying demand. The ongoing, substantial inflows into gold ETFs show that major investors continue to view physical gold as a safe haven. This persistent buying provides strong support for the market, suggesting that the sharp correction may simply be a healthy pause rather than the start of a longer-term reversal.
Looking Ahead: Key Drivers and Risks for Gold's Next Move
The next major catalyst is the official confirmation of the new Federal Reserve Chair. If a hawkish candidate like Kevin Warsh is appointed, the dollar is likely to remain strong, putting further pressure on gold prices. Last week's market reaction to the appointment news demonstrated this dynamic, as a stronger dollar made gold less affordable for buyers outside the U.S. How the market responds to the Fed announcement will be crucial in determining whether this is a short-lived sentiment shock or the beginning of a more lasting trend.
Investors should closely monitor February's flow data. The $19 billion in ETF inflows during January showed that institutional demand was strong enough to absorb the recent selloff. Continued robust inflows this month would reinforce the view that the pullback is temporary and healthy. On the other hand, a reversal in flows could signal weakening structural support and serve as a warning sign for the market.
Technical levels are especially important in this volatile environment. The $4,900 area is a critical support zone; if prices fall below this level, further stop-loss selling could be triggered. On the upside, $5,200 represents the next resistance point for any recovery. With trading volumes at historic highs, movements through these key levels are likely to be swift and pronounced. Overall, the market appears to be testing its recent lows, while strong investment flows continue to underpin the broader bullish narrative.
Disclaimer: The content of this article solely reflects the author's opinion and does not represent the platform in any capacity. This article is not intended to serve as a reference for making investment decisions.
You may also like
Lupaka Gold may seize Peru state assets over unpaid $67M arbitration award
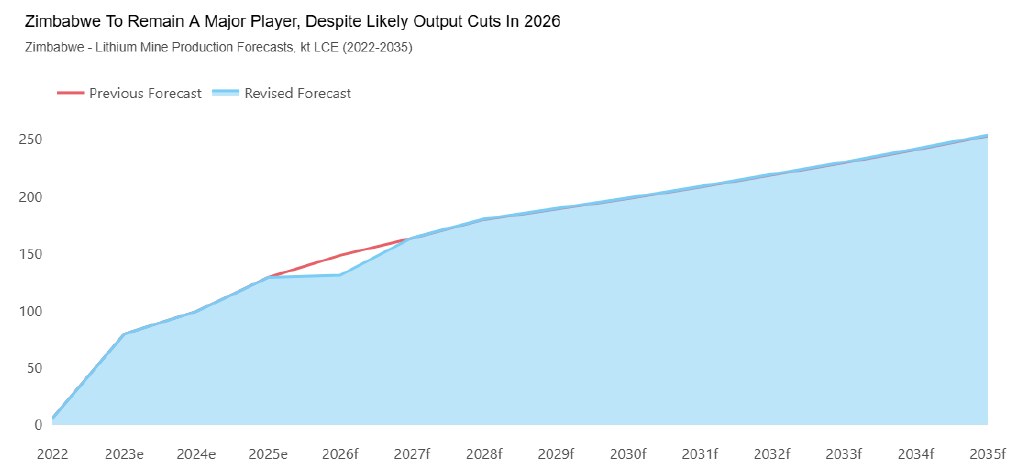
Zimbabwe export ban a temporary dent on lithium supply, says Fitch’s BMI
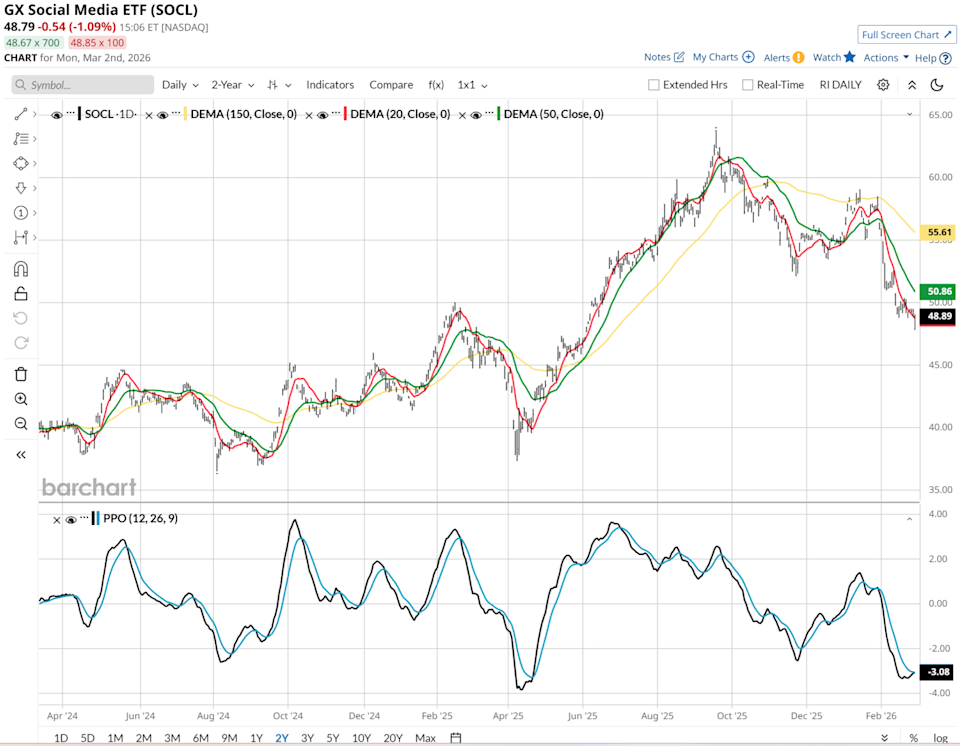
This Once Popular Social Media ETF Is Becoming Increasingly Anti-Social
Short Squeeze And Earnings: Why Paysafe Stock Spiked Tuesday