coinedition.com
Solana price today trades near $85.83, down 1.33% after testing the apex of a symmetrical triangle pattern that has guided price since mid-February. The move places buyers and sellers in equilibrium as consistent ETF inflows clash with technical compression.
Open Interest Drops 1.99% As Triangle Compresses
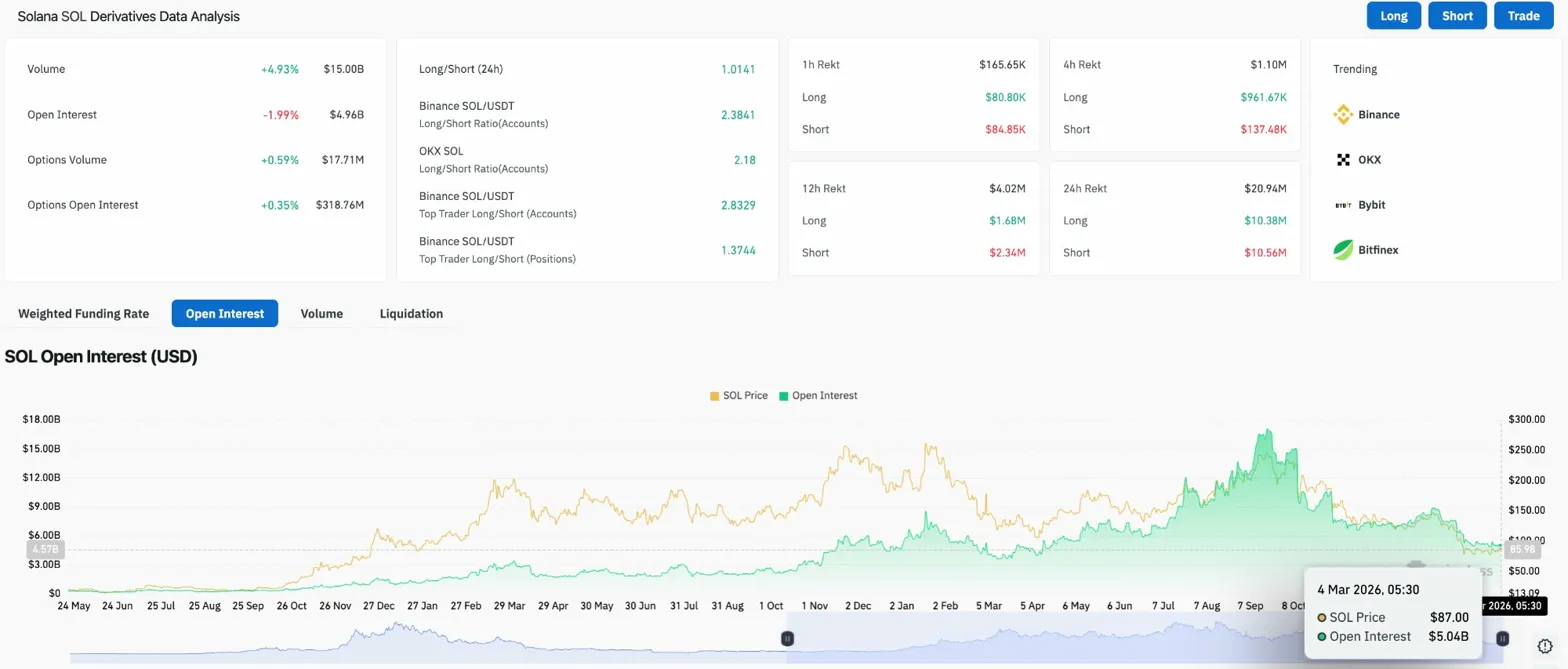
Open interest declined 1.99% to $4.96 billion while volume surged 4.93% to $15.00 billion. The combination shows active trading as price consolidates near the triangle apex, with participants positioning for the breakout direction.
The long/short ratio on Binance sits at 2.38 for accounts and 2.83 for top traders, showing leverage remains heavily tilted toward longs. Total liquidations hit $1.10 million, with longs accounting for $961.67K, clearing overleveraged bullish positions near resistance.
Options volume rose 0.59% to $17.71 million while options OI jumped 0.35% to $318.76 million, reflecting increased hedging activity as the triangle apex approaches.
ETF Inflows Extend 23-Day Streak Despite Price Weakness
Solana spot ETFs recorded $1.03 million in net inflows on March 3, extending an unprecedented 23-day streak of consecutive positive flows that began February 10. The streak represents the longest period of sustained institutional buying since Solana ETFs launched.
Cumulative net inflows now stand at $952.37 million, representing 1.66% of Solana’s market cap. The daily flow chart shows consistent green bars since February 10, with only minor variations in magnitude. The largest single-day inflow during the streak was $17.41 million on March 2, while the smallest was $507,800 on February 27.
Daily Chart Shows Support Zone Defense
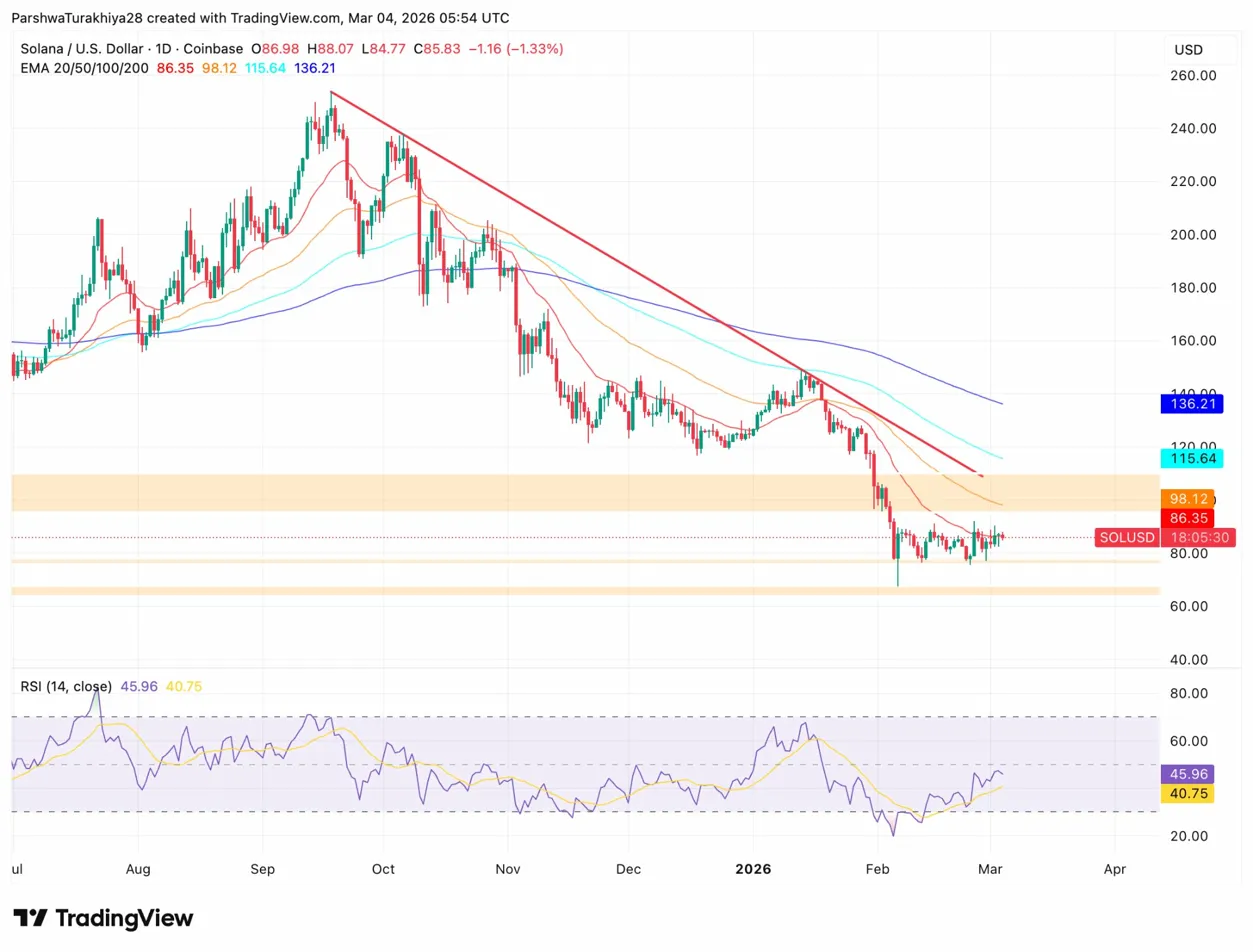
The daily chart shows Solana defending the $80 to $100 support zone (orange shaded area) that has acted as a floor since the February spike low. Price is trading below all four major EMAs, with the 20-day at $86.35, 50-day at $98.12, 100-day at $115.64, and 200-day at $136.21 forming a descending resistance ladder.
A descending trendline (red line) has capped rallies since September 2024 highs near $260. The RSI sits at 45, hovering in neutral territory and showing neither oversold nor overbought conditions.
Key levels:
- Immediate support: $80 to $85 (lower triangle boundary)
- Critical floor: $75 to $70
- First resistance: $86.35 (20-day EMA)
- Triangle upper boundary: $88 to $89
Symmetrical Triangle Apex Signals Imminent Breakout
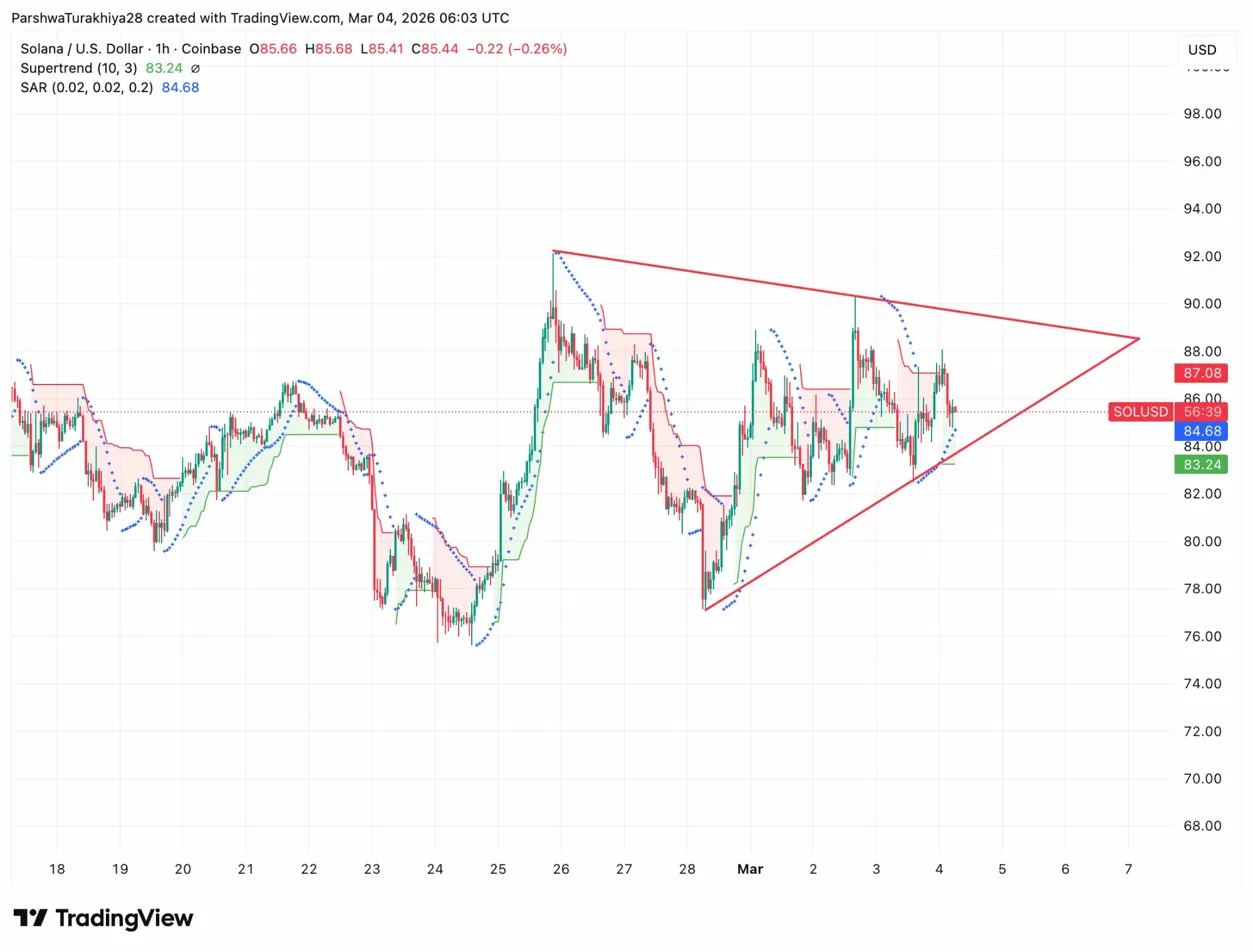
The 1-hour chart shows Solana compressing within a symmetrical triangle (red converging lines) that has tightened since mid-February. The triangle apex sits near current price levels, suggesting a directional breakout is imminent within the next 24 to 48 hours.
The Supertrend at $83.24 provides immediate support, while the Parabolic SAR at $84.68 acts as dynamic resistance. Price is squeezed between these two indicators as the triangle narrows.
Related: Cardano Price Prediction: Hoskinson Slams Security Framework as ADA Tests $0.26
A break above the upper triangle boundary near $88 to $89 would target the 20-day EMA at $86.35 and potentially the $98 to $100 zone. A breakdown below the lower boundary near $83 to $84 exposes the February spike low at $75 to $78.
The symmetrical triangle pattern typically resolves in the direction of the prior trend, which in Solana’s case is bearish from the September highs. However, the 23-day ETF inflow streak creates a fundamental counterforce that could support an upside breakout.
Outlook: Will Solana Go Up?
The next move depends on whether Solana can break above the triangle resistance or if sellers push through support at the apex.
- Bullish case: Solana breaks above $88 with rising volume and sustained ETF inflows. That confirms the triangle breakout and targets the 20-day EMA at $86.35, with potential continuation toward $98 to $100.
- Bearish case: A breakdown below $83 invalidates the triangle support and exposes the $75 to $78 demand zone. Losing that level opens the door to $70 and potentially $67.