
2 Things to Appreciate About WK (and 1 That’s Less Favorable)

Workiva Stock Performance: Recent Trends
In the last half-year, Workiva's share price dropped to $61.97, resulting in an 18.5% loss for investors. This decline stands in stark contrast to the S&P 500, which rose by 5.7% during the same period. Such underperformance may leave shareholders reconsidering their investment strategy.
With this recent downturn, is it an opportune moment to invest in Workiva (WK)?
What Makes Workiva a Hot Topic?
Workiva (NYSE:WK), sometimes referred to as "the Excel killer" by industry insiders, offers a cloud-based solution that helps organizations simplify financial reporting, ESG initiatives, and compliance tasks through integrated data and automation. This platform aims to reduce the confusion often associated with spreadsheets.
Key Strengths of Workiva
1. Strong Growth in Annual Recurring Revenue (ARR)
Unlike total revenue, which may include lower-margin services such as implementation fees, annual recurring revenue (ARR) focuses solely on contracted software subscriptions for the upcoming year. This metric highlights the stable, high-margin income streams that are highly valued in SaaS companies.
In the fourth quarter, Workiva reported ARR of $877.3 million. Over the past year, its ARR grew at an average annual rate of 21.7%, reflecting strong customer confidence and long-term commitments to its technology. This steady growth enhances the predictability of Workiva’s business, a quality that typically appeals to investors seeking reliable recurring revenue.
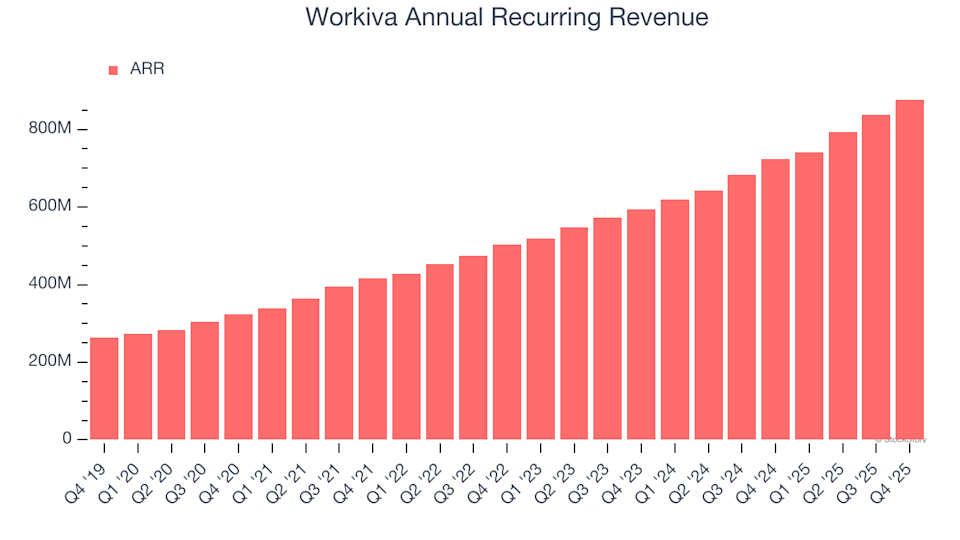
Workiva Annual Recurring Revenue
2. Exceptional Gross Margins Support a Leading Business Model
The software industry is renowned for its scalable business models, where the cost of delivering services remains relatively low after the initial product development. Ongoing expenses are generally limited to infrastructure, licensing, and select personnel.
Workiva stands out with superior unit economics compared to many peers, thanks to its asset-light approach and pricing strength. These advantages allow the company to reinvest in product innovation and sales expansion, positioning it for substantial profitability as it scales. Over the past year, Workiva maintained an impressive average gross margin of 78.5%, meaning it spent just $21.53 for every $100 earned in revenue.
Investors pay close attention not only to the level of gross margins but also to their trajectory. Improvements in this area signal greater potential for profitability and cash flow. Notably, Workiva’s gross margin has increased by 3 percentage points over the last two years—a strong showing within the software sector.
Workiva Trailing 12-Month Gross Margin
Potential Concern: Profitability Metrics
Operating Margins on the Rise
While some software companies highlight adjusted profits that exclude stock-based compensation (SBC), we believe GAAP operating margin offers a more accurate picture, as SBC is a real cost tied to attracting and retaining talent. This metric reveals how much revenue remains after covering all essential expenses, including cost of goods sold, sales, and research and development.
Over the past two years, Workiva has benefited from operating leverage as its sales expanded, resulting in a 5.6 percentage point improvement in operating margin. Although its trailing 12-month operating margin remains negative at -4.8%, there is optimism that the company can achieve lasting profitability in the future.
Workiva Trailing 12-Month Operating Margin (GAAP)
Conclusion: Is Workiva a Buy?
Workiva’s strengths appear to outweigh its weaknesses. Following its recent decline, the stock is now valued at 3.4 times forward price-to-sales, or $61.97 per share. Should you consider adding it to your portfolio?
Other Compelling Stocks to Watch
Don’t Miss: Top 5 Momentum Stocks. The ideal time to invest in a standout stock is when the market starts to recognize its potential. These companies combine strong fundamentals with recent momentum—an attractive combination for investors.
Discover which stocks our AI-driven platform is highlighting this week. Access the list of this week’s Strong Momentum stocks for free.
Past selections have included well-known names like Nvidia, which soared 1,326% from June 2020 to June 2025, as well as lesser-known companies such as Kadant, which delivered a 351% return over five years.
Disclaimer: The content of this article solely reflects the author's opinion and does not represent the platform in any capacity. This article is not intended to serve as a reference for making investment decisions.
You may also like
UK: Energy shock risks complicating BoE cuts – Deutsche Bank
GSR withdrew 3000 ETH from an exchange 3 hours ago
MANTRA Launches With 37% Rally Following OM Token Swap
