Dycom Shares Decline: A Flow Event Triggered by Changes in Forecasts

Significant Drop in Stock Price Triggered by EPS Estimate Cut
Shares fell sharply by 4.81% to $405.01, primarily due to a notable signal in market flows: analysts lowered their consensus earnings-per-share (EPS) forecast by 17% over the past month. The revised estimate now stands at $1.66 per share for the upcoming report, reflecting weaker short-term profit expectations. This decline was further intensified by light trading activity, with only 72,211 shares changing hands—far below the 90-day average—making the price more susceptible to volatility.
Strong Operational Performance: Backlog and Revenue Growth
Despite the recent price action, the company’s core business remains healthy. The total order backlog has reached $7.99 billion, a 3% increase compared to last year, providing solid revenue visibility. In the latest quarter, contract revenue climbed 13.9% to $1.085 billion, and the adjusted EBITDA margin improved by 89 basis points to 10.7%.
Looking ahead, management has raised its outlook, projecting full-year 2026 revenue growth between 12.5% and 15.4%. This positive stance is further supported by a newly approved $150 million share buyback program, offering an additional incentive for shareholders.
Valuation Discrepancy and Potential Catalysts
Currently, the market values Dycom at a market capitalization of $12.75 billion, which is significantly below the consensus price target of $346.58. This suggests considerable room for upside, with recent analyst opinions pointing to a possible 20% increase from current prices. The main drivers that could help close this gap are successful execution of the higher 2026 revenue targets and the implementation of the new $150 million share repurchase plan.
Momentum Strategy Backtest Overview
A long-only momentum strategy for DY involves entering a position when the 252-day rate of change is positive and the closing price is above the 200-day simple moving average (SMA). Exits are triggered if the price falls below the 200-day SMA, after 20 trading days, or if a take-profit of +8% or stop-loss of −4% is reached.
- Entry Condition: 252-day rate of change > 0 and close > 200-day SMA
- Exit Condition: Close < 200-day SMA, or after 20 days, or take-profit +8%, or stop-loss −4%
- Risk Controls: Take-profit at 8%, stop-loss at 4%, maximum holding period of 20 days
Backtest Results
- Total Return: 24.36%
- Annualized Return: 11.6%
- Maximum Drawdown: 1.39%
- Win Rate: 1.05%
Trade Statistics
- Total Trades: 191
- Winning Trades: 2
- Losing Trades: 0
- Average Holding Period: 0.09 days
- Max Consecutive Losses: 0
- Profit/Loss Ratio: 0
- Average Win Return: 12.01%
- Average Loss Return: 0%
- Largest Single Gain: 22.5%
- Largest Single Loss: 0%
Risks and Uncertainties
There are still notable risks. The company’s guidance does not factor in potential revenue from state broadband initiatives (BEAD), as the timing for these programs remains unclear. Additionally, the outlook excludes storm restoration projects, which have historically provided a boost to quarterly earnings. The stock’s future performance will depend on management’s ability to achieve its ambitious targets while managing these uncertain revenue streams.
Disclaimer: The content of this article solely reflects the author's opinion and does not represent the platform in any capacity. This article is not intended to serve as a reference for making investment decisions.
You may also like
Brown-Forman's Trade War Hangover: A Historical Lens on the Jack Daniel's Decline
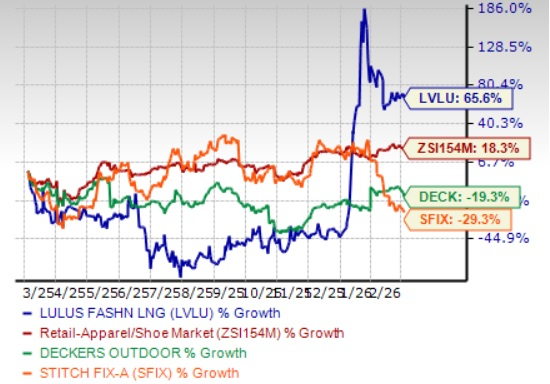
Lulus Stock Surges 66% Over the Past Year: Is Now the Time to Invest?
A $2 Billion Motive to Invest in Lumentum Shares Today
SHIB Surges +5% as Meme Coins Catch a Bid: What’s Next for Shiba Inu?