
It's a time for OKLO.US/ 50% potential profit - 100 USD

By:TradingView
On the daily chart of Oklo Inc. (OKLO), the price appears to be stabilizing after a prolonged downward phase, forming a base in the 60–65 USD region where buying interest has emerged. This area is acting as a technical support zone, and recent candlestick behavior suggests that selling pressure is fading. The stock is beginning to build a short-term consolidation structure, which often precedes a rebound.
Momentum indicators show early signs of improvement, with downside momentum weakening and the market starting to form higher local lows. If price holds above the current support area and buying volume increases, an acceleration to the upside becomes more likely.
Under this scenario, the 100 USD level represents a natural upside target. It serves as both a psychological barrier and a technical resistance area based on prior price reactions. A move toward 100 USD would signal a broader recovery and a shift toward a more constructive medium-term outlook.
Potential TP: 100 USD
0
0
Disclaimer: The content of this article solely reflects the author's opinion and does not represent the platform in any capacity. This article is not intended to serve as a reference for making investment decisions.
PoolX: Earn new token airdrops
Lock your assets and earn 10%+ APR
Lock now!
You may also like
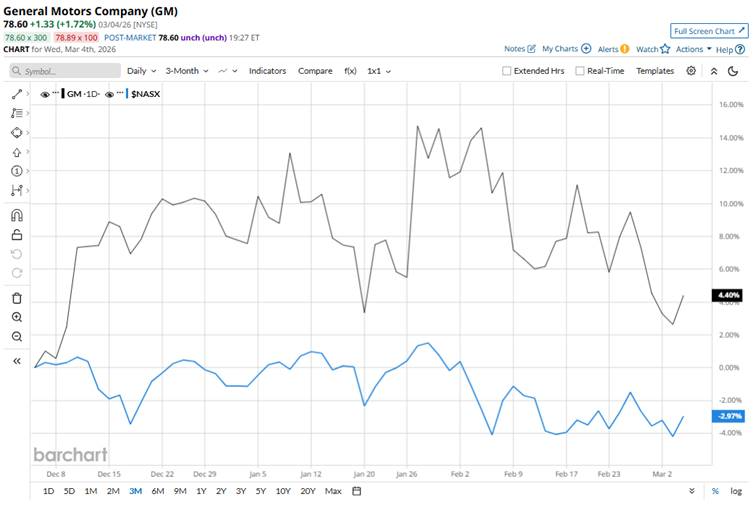
Is General Motors Company’s Stock Beating the Nasdaq’s Performance?
101 finance•2026/03/05 11:27
UK's Nothing splashes colour on new phones to shake up 'boring' tech
101 finance•2026/03/05 11:27
Rockefeller Capital Management Boosts Stake in Bitcoin Treasury Firm Strategy by 146%
CryptoNewsNet•2026/03/05 11:27

Hong Kong Central Bank Pilots Blockchain for Seamless Cross-Border Asset Transfers
Cointurk•2026/03/05 11:21
Trending news
MoreCrypto prices
MoreBitcoin
BTC
$73,107.41
+2.47%
Ethereum
ETH
$2,147.72
+3.65%
Tether USDt
USDT
$1
+0.03%
BNB
BNB
$662.16
+1.56%
XRP
XRP
$1.44
+2.34%
USDC
USDC
$0.9998
-0.02%
Solana
SOL
$92.31
+1.99%
TRON
TRX
$0.2845
+0.13%
Dogecoin
DOGE
$0.09745
+4.77%
Cardano
ADA
$0.2758
+1.89%
How to buy BTC
Bitget lists BTC – Buy or sell BTC quickly on Bitget!
Trade now
Become a trader now?A welcome pack worth 6200 USDT for new users!
Sign up now