
Bitcoin Historically Bottoms Between These MVRV Levels—Where Are They Now?

By:Newsbtc
An analyst has highlighted how Bitcoin has consistently bottomed out between the 1.0 and 0.8 MVRV pricing bands during the past decade.
Bitcoin Still Hasn’t Breached Below 1.0 MVRV Band In This Cycle
In a new post on X, analyst Ali Martinez has talked about historical Bitcoin bottoms from the perspective of the MVRV Pricing Bands. This is an on-chain pricing model for BTC that’s based on the popular Market Value to Realized Value (MVRV) Ratio.

The MVRV Ratio measures how the market cap of BTC, a representation of the value that investors are carrying in the present, compares against the Realized Cap, a proxy for the total capital invested into the cryptocurrency. In short, this indicator tells us about the profit-loss balance of BTC holders as a whole.
var rnd = window.rnd || Math.floor(Math.random()*10e6); var pid607465 = window.pid607465 || rnd; var plc607465 = window.plc607465 || 0; var abkw = window.abkw || ''; var absrc = 'https://servedbyadbutler.com/adserve/;ID=172179;size=0x0;setID=607465;type=js;sw='+screen.width+';sh='+screen.height+';spr='+window.devicePixelRatio+';kw='+abkw+';pid='+pid607465+';place='+(plc607465++)+';rnd='+rnd+';click=CLICK_MACRO_PLACEHOLDER'; document.write('
');
if (!window.AdButler){(function(){var s = document.createElement("script"); s.async = true; s.type = "text/javascript";s.src = "https://servedbyadbutler.com/app.js";var n = document.getElementsByTagName("script")[0]; n.parentNode.insertBefore(s, n);}());}
var AdButler = AdButler || {}; AdButler.ads = AdButler.ads || []; var abkw = window.abkw || ""; var plc366606 = window.plc366606 || 0; (function(){ var divs = document.querySelectorAll(".plc366606:not([id])"); var div = divs[divs.length-1]; div.id = "placement_366606_"+plc366606; AdButler.ads.push({handler: function(opt){ AdButler.register(172179, 366606, [728,90], "placement_366606_"+opt.place, opt); }, opt: { place: plc366606++, keywords: abkw, domain: "servedbyadbutler.com", click:"CLICK_MACRO_PLACEHOLDER" }}); })();
When the value of the MVRV Ratio is greater than 1.0, it means the average investor is currently holding a net unrealized profit. On the other hand, it being under the threshold implies the dominance of losses on the network.
Generally, the higher the investor profits get, the more likely they become to take part in profit-taking. Thus, tops can become more likely to occur as the MVRV Ratio diverges far above 1.0. Similarly, selling can reach exhaustion when the majority of the supply is underwater, implying bottoms may become probable at low MVRV levels.
Based on these behaviors, on-chain analytics firm Glassnode has created the MVRV Pricing Bands, which is a model that highlights Bitcoin price levels corresponding to certain key MVRV Ratio levels.
var rnd = window.rnd || Math.floor(Math.random()*10e6); var pid607472 = window.pid607472 || rnd; var plc607472 = window.plc607472 || 0; var abkw = window.abkw || ''; var absrc = 'https://servedbyadbutler.com/adserve/;ID=172179;size=0x0;setID=607472;type=js;sw='+screen.width+';sh='+screen.height+';spr='+window.devicePixelRatio+';kw='+abkw+';pid='+pid607472+';place='+(plc607472++)+';rnd='+rnd+';click=CLICK_MACRO_PLACEHOLDER'; document.write('
');
if (!window.AdButler){(function(){var s = document.createElement("script"); s.async = true; s.type = "text/javascript";s.src = "https://servedbyadbutler.com/app.js";var n = document.getElementsByTagName("script")[0]; n.parentNode.insertBefore(s, n);}());}
var AdButler = AdButler || {}; AdButler.ads = AdButler.ads || []; var abkw = window.abkw || ""; var plc452518 = window.plc452518 || 0; (function(){ var divs = document.querySelectorAll(".plc452518:not([id])"); var div = divs[divs.length-1]; div.id = "placement_452518_"+plc452518; AdButler.ads.push({handler: function(opt){ AdButler.register(172179, 452518, [728,90], "placement_452518_"+opt.place, opt); }, opt: { place: plc452518++, keywords: abkw, domain: "servedbyadbutler.com", click:"CLICK_MACRO_PLACEHOLDER" }}); })();
Below is the chart for the indicator shared by Martinez.
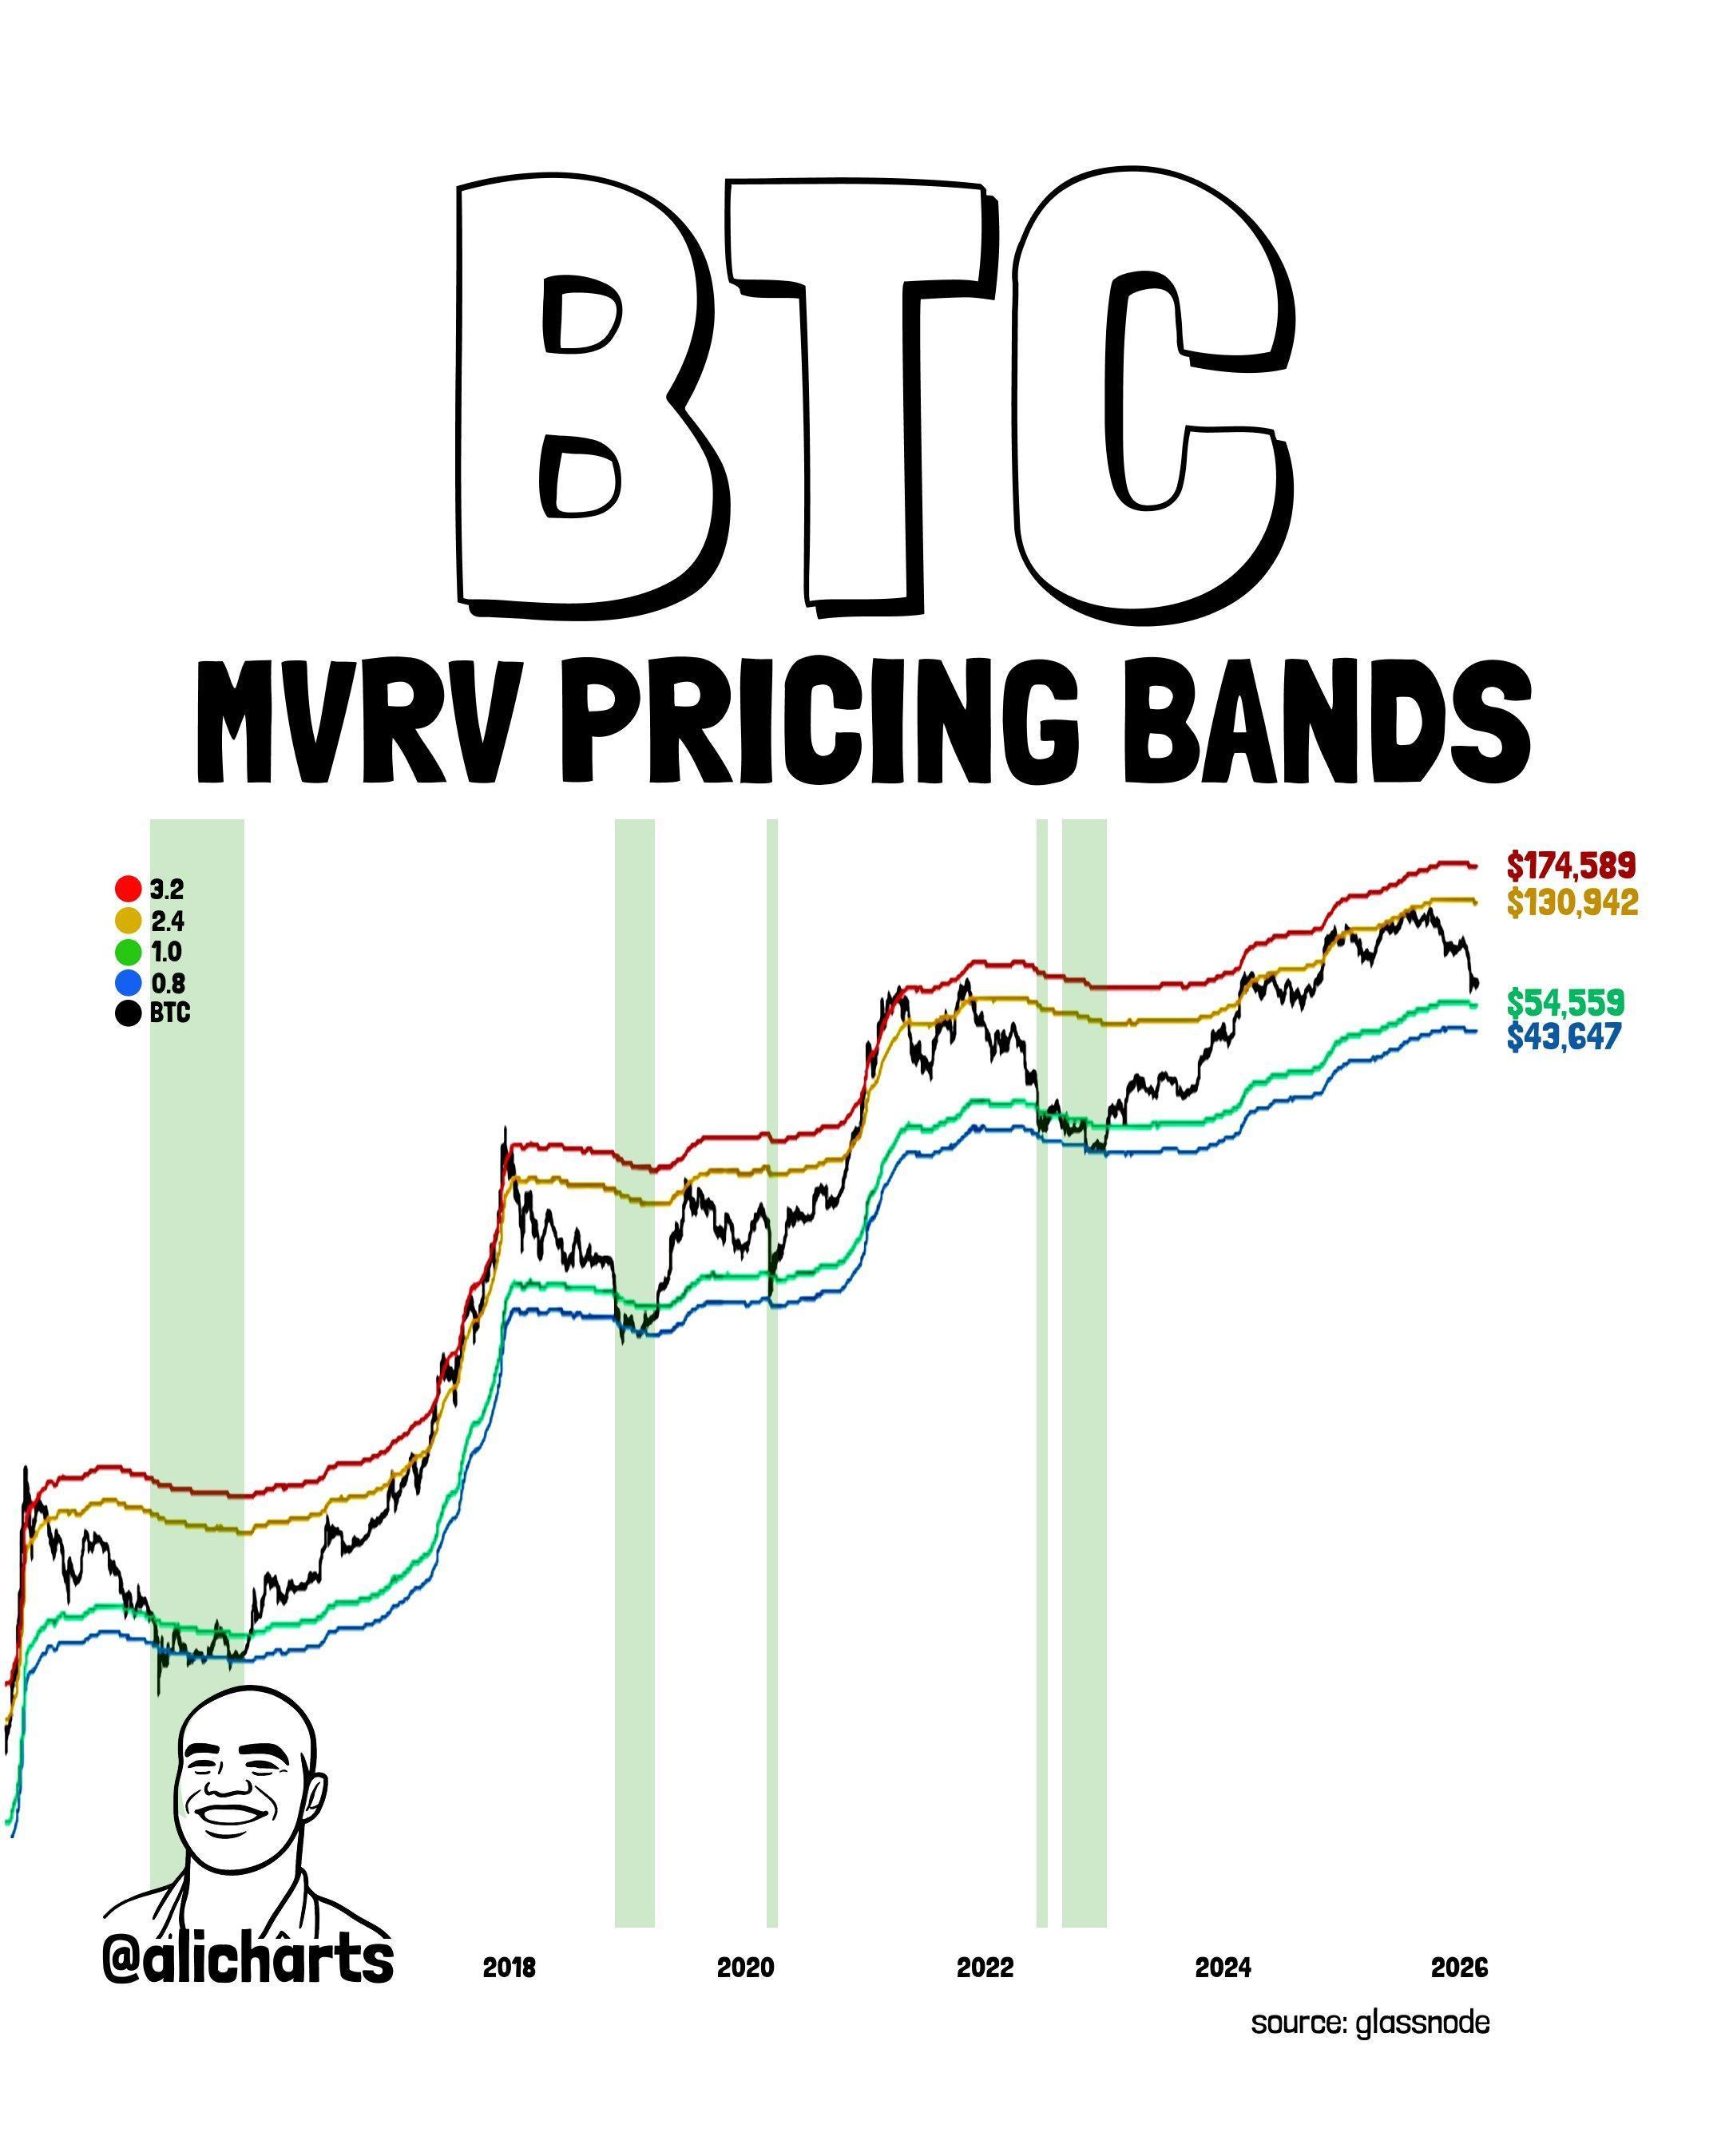 Looks like the price of the coin is currently trading under two of the levels | Source:
@alicharts on X
Looks like the price of the coin is currently trading under two of the levels | Source:
@alicharts on X
From the graph, it’s visible that the Bitcoin price has been trading below both the 2.4 and 3.2 bands for a while now. These levels, situated around $130,000 and $174,000, respectively, correspond to thresholds where profit realization risk becomes significant.
The cryptocurrency has faced bearish momentum recently, but its price has continued to hold above the 1.0 level. This means that despite the drawdown, the investors as a whole have remained in a state of net unrealized gain.
var rnd = window.rnd || Math.floor(Math.random()*10e6); var pid607473 = window.pid607473 || rnd; var plc607473 = window.plc607473 || 0; var abkw = window.abkw || ''; var absrc = 'https://servedbyadbutler.com/adserve/;ID=172179;size=0x0;setID=607473;type=js;sw='+screen.width+';sh='+screen.height+';spr='+window.devicePixelRatio+';kw='+abkw+';pid='+pid607473+';place='+(plc607473++)+';rnd='+rnd+';click=CLICK_MACRO_PLACEHOLDER'; document.write('
');
if (!window.AdButler){(function(){var s = document.createElement("script"); s.async = true; s.type = "text/javascript";s.src = 'https://servedbyadbutler.com/app.js';var n = document.getElementsByTagName("script")[0]; n.parentNode.insertBefore(s, n);}());}
var AdButler = AdButler || {}; AdButler.ads = AdButler.ads || []; var abkw = window.abkw || ''; var plc452519 = window.plc452519 || 0; (function(){ var divs = document.querySelectorAll(".plc452519:not([id])"); var div = divs[divs.length-1]; div.id = "placement_452519_"+plc452519; AdButler.ads.push({handler: function(opt){ AdButler.register(172179, 452519, [728,90], 'placement_452519_'+opt.place, opt); }, opt: { place: plc452519++, keywords: abkw, domain: 'servedbyadbutler.com', click:'CLICK_MACRO_PLACEHOLDER' }}); })();
In the chart, the analyst has pointed out a pattern that Bitcoin has tended to follow with MVRV Pricing Bands. “Over the past decade, Bitcoin $BTC has consistently bottomed between the 1.0 and 0.8 MVRV Pricing Bands,” said Martinez. Currently, these levels sit near $54,000 and $43,000, respectively.

Bitcoin LTH Selling Cools: Is Months-Long Distribution Finally Ending?
It now remains to be seen whether BTC will continue to go down in the near future and retest this historical bottoming zone, or the asset will find a low before it, breaking the pattern from the previous cycles. The coin has already broken one pattern this time: it hasn’t been able to breach the 3.2 level a single time.
BTC Price
At the time of writing, Bitcoin is trading around $73,000, up more than 6% over the past week.
 The trend in the price of the coin over the last five days | Source:
BTCUSDT on TradingView
The trend in the price of the coin over the last five days | Source:
BTCUSDT on TradingView
0
0
Disclaimer: The content of this article solely reflects the author's opinion and does not represent the platform in any capacity. This article is not intended to serve as a reference for making investment decisions.
PoolX: Earn new token airdrops
Lock your assets and earn 10%+ APR
Lock now!
You may also like
UAE central bank says financial system stable amid missile and drone attacks
Cointelegraph•2026/03/05 11:18

CrowdStrike Lands EU-Sovereign Cloud Deal
Finviz•2026/03/05 11:18
'It remains unclear at this stage how the Middle East conflict will affect New Zealand's economy'
101 finance•2026/03/05 11:12
Trending news
MoreCrypto prices
MoreBitcoin
BTC
$73,169.95
+2.43%
Ethereum
ETH
$2,151.59
+3.68%
Tether USDt
USDT
$1
+0.02%
BNB
BNB
$662.35
+1.60%
XRP
XRP
$1.44
+2.49%
USDC
USDC
$1
+0.00%
Solana
SOL
$92.31
+2.16%
TRON
TRX
$0.2846
+0.24%
Dogecoin
DOGE
$0.09745
+4.86%
Cardano
ADA
$0.2761
+2.20%
How to buy BTC
Bitget lists BTC – Buy or sell BTC quickly on Bitget!
Trade now
Become a trader now?A welcome pack worth 6200 USDT for new users!
Sign up now