u.today
After months of consistent selling pressure and lower highs, the market may finally be exhibiting the first indications of a structural recovery in 2026. Ethereum, Bitcoin and even Shiba Inu stabilized after being stuck in a downward trend for the majority of the last few months.
Ethereum gains foothold
$ETH is trading close to $2,080, making a slight comeback following a steep drop earlier in the year that sent the asset well below the crucial $2,500-$2,800 range. Before buyers intervened, the price of Ethereum reached the $1,900 range during that breakdown, which was one of the strongest selling waves in months.
The structure of the subsequent rebound is what distinguishes the current situation. Ethereum was able to stabilize and create a short-term higher low after reaching a local bottom, indicating that the strong downward momentum may finally be abating.
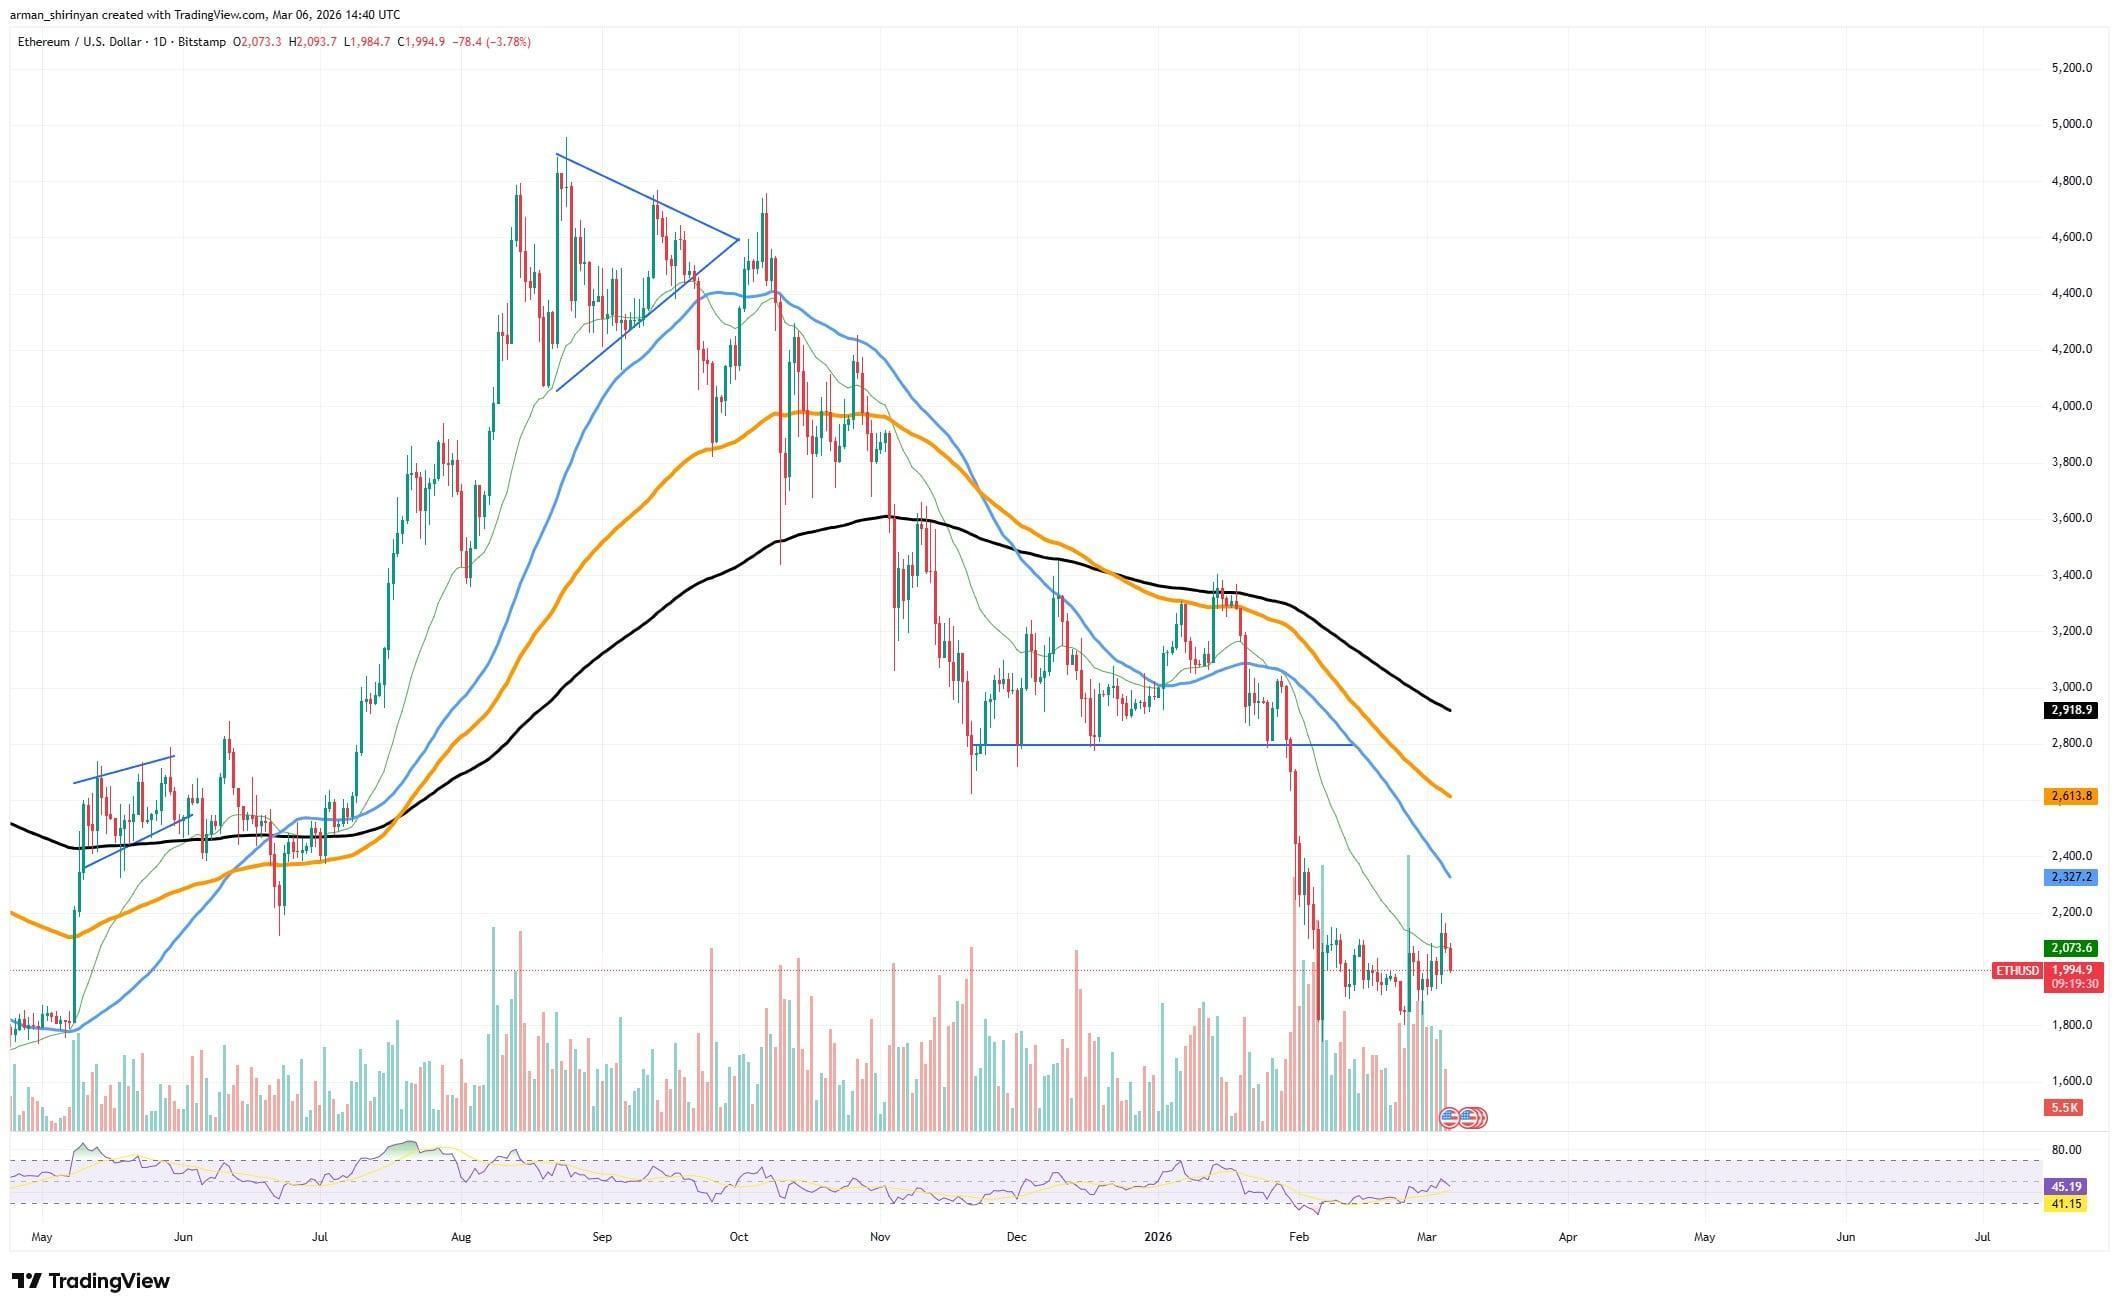
In technical terms, Ethereum is trying to recover ground above the short-term moving averages that served as resistance earlier in the decline. The price is now interacting with the green short-term average from above rather than continuously rejecting it, as it has started to flatten out.
Early on in trend reversals, this subtle shift frequently manifests. Additionally, volume behavior supports the attempt at recovery. The recovery from the recent lows coincided with increased trading activity, indicating that real buying pressure rather than a brief spike in liquidity supported the move.
However, before a complete recovery narrative can be developed, the larger market structure still needs to be confirmed. Ethereum is still below significant resistance levels, especially the $2300-$2600 range, where the 26-day exponential moving average and other important technical indicators are situated.
The current rebound could develop into the recovery phase that many investors have been waiting for if $ETH can keep creating higher lows and regaining those resistance levels.
Will Bitcoin stay above $70,000?
Although Bitcoin has once again entered the $70,000 price range, the market is still having difficulty stabilizing at these levels. Although the recent surge from the $63,000 area was powerful enough to push Bitcoin back into the low $70,000 range, the price action indicates that the asset is still uncomfortable trading above this psychological barrier.
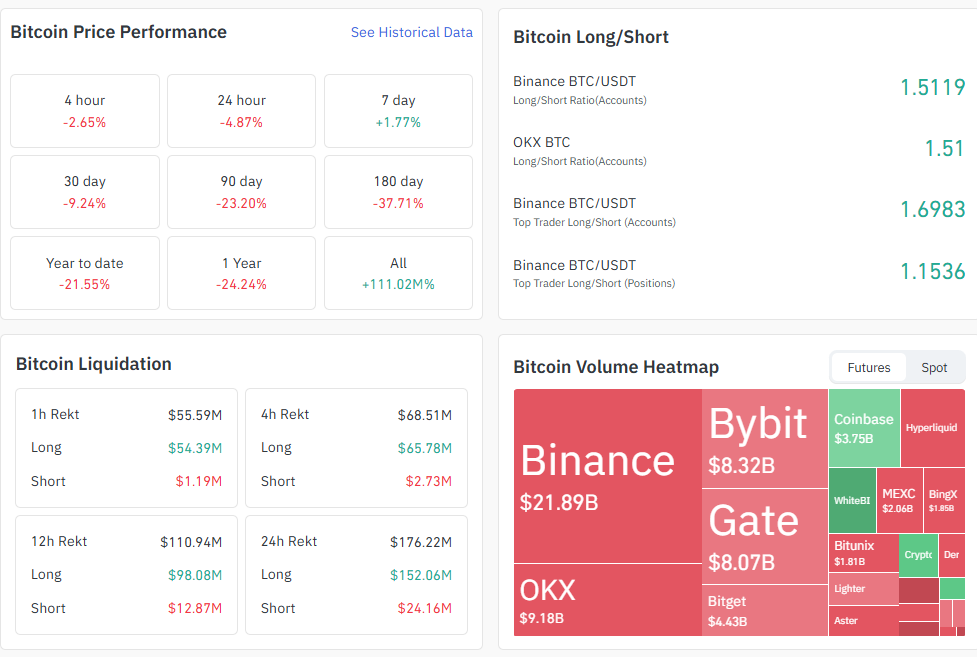
After a strong recovery rally, Bitcoin is currently trading within a small range at $70,900. The action followed a sharp decline earlier in the year that pushed the market well below $70,000 and drove many traders out of leveraged positions.
Since then, Bitcoin has been making an effort to regain momentum, but the recovery’s structure is still unstable. Liquidity is the main problem. Instead of just touching or momentarily surpassing the $70,000 mark, Bitcoin must establish a solid support base around that level for a long-term bullish continuation.
Short-term consolidation
Bitcoin is currently pushing above the upper limit of a short-term consolidation pattern, according to the chart. The asset has not spent enough time consolidating above $70,000 to confirm that the market is prepared for the next leg higher, even though this breakout is technically bullish.
This uncertainty can also be seen in volume patterns. Increased trading activity accompanied the rebound toward $70,000, but persistent buying pressure is still needed to establish the level as support.
The market may progressively accumulate the liquidity required to stabilize the price if buyers keep defending the area during declines. The next resistance clusters in the $74,000-$75,000 range will probably serve as the next battlefield for bulls and bears once Bitcoin has successfully established the $70,000 range as support.
Shiba Inu in calamity
With the asset’s overall volatility continuing to decline, Shiba Inu seems to have entered one of its quietest periods in months.
Following a protracted decline that drove $SHIB steadily lower throughout late 2025 and early 2026, the market has now entered a narrow consolidation range, where price movement has become less noticeable. After a few weeks of steady decline, $SHIB is currently trading at $0.0000055, varying within a small range.
Although the intense selling pressure that previously drove the asset lower has mostly subsided, buyers have not yet demonstrated sufficient strength to initiate a significant recovery. Because of this, the token is presently trapped in a market structure that is best described as neutral.
$SHIB has been creating ever-tinier consolidation patterns, such as short descending triangles, that have progressively stifled price movement. Generally speaking, these structures indicate market indecision rather than a distinct directional trend.
The midterm averages, which are still sloping downward, are among the major trend indicators that $SHIB continues to trade below. This indicates that the larger bearish structure is still valid despite the slowdown in selling pressure.
Significant rallies for meme assets like Shiba Inu frequently rely on substantial inflows of speculative capital. It seems that the market is currently devoid of that kind of bullish liquidity. Even small upward movements often lose momentum quickly in the absence of new buying interest.