Falling energy availability per person is the most significant challenge facing the world

Examining Global Energy Consumption and Its Economic Implications
Several years ago, I conducted a detailed study of worldwide energy usage, separating the increase in consumption into two main components: the energy required to sustain a growing global population and the additional energy that enables improvements in living standards. This research, which spanned from 1820 to 2020, revealed that times of minimal energy growth often aligned with periods of conflict, economic downturns, or societal collapse. This pattern is logical, as every sector of the economy depends on sufficient and suitable energy resources.
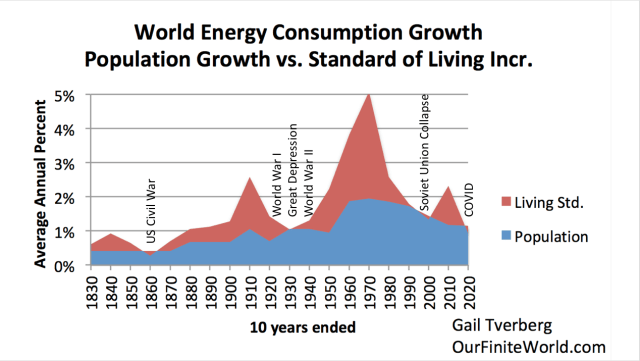
A line chart illustrating the relationship between global energy consumption, population growth, and rising living standards from 1830 to 2020. The chart highlights key historical events and trends over time.
Figure 1 presents data from 2021, displaying the average yearly increase in global energy use over ten-year intervals. The chart distinguishes between the energy needed for population growth and the surplus that supports higher living standards.
In this article, I update the analysis using five-year intervals ending in 2024 to better reflect recent shifts in energy use and demographic trends. The findings suggest that recent growth in total energy supply has been inadequate to prevent significant challenges. A closer look shows that the expansion of certain crucial resources—such as diesel and jet fuel, as well as minerals essential for electricity generation and consumption—is especially concerning.
Signs of Reaching Energy Boundaries
The evidence points to the global economy already encountering energy constraints. As shortages become more apparent, nations are responding with protectionist measures reminiscent of a game of musical chairs, where there are not enough seats for all participants. Governments are increasing military spending, restricting exports of vital minerals, imposing tariffs, and engaging in military actions—moves that may seem irrational to those who favor peace.
Comparing Energy Growth and Population Trends
Figure 2: Stacked Bar Chart Reflecting Similar Patterns as Figure 1
Bar chart comparing the growth of global energy consumption (red) and population (blue) from 1830 to 2020, showing average annual increases by decade.
Figure 2 breaks down the average global increase in energy use into two parts: the energy required to maintain current living standards for a growing population, and the remainder available for raising those standards. This visualization presents the same data as Figure 1, but in a different format.
The sum of the red and blue bars represents the total average annual rise in energy consumption for each decade. The blue segment (typically at the base) covers the energy needed to maintain existing services as the population grows, while the red segment (usually on top) shows the surplus. Large red sections are positive, indicating rising per-capita energy, whereas red segments below zero signal a decline in energy available per person.
Economic Prosperity and Energy Expansion
Periods of Rapid Energy Growth Align with Economic Booms
Annotations on Figure 1 highlight how periods of low energy growth have historically led to negative outcomes. Conversely, times of robust energy expansion have generally coincided with economic prosperity.
One notable peak in both figures occurs between 1901 and 1910, a time marked by early electrification and advances in agricultural mechanization. Before 1913, the UK reached its maximum coal output, limiting further profitable extraction. Germany experienced a similar peak in coal production just before World War II. After these peaks, less coal was available per person, prompting leaders to pursue war as resources became scarce.
After World War II, energy consumption surged during the 1950s, 1960s, and 1970s. Another, smaller peak in the 2001–2010 period followed China’s entry into the World Trade Organization, which led to increased coal use and a shift of manufacturing to China, reducing costs and emissions in wealthier countries.
These patterns are expected if the global economy operates within the constraints of physical laws. Sustained economic growth requires abundant, affordable energy compatible with existing infrastructure.
Recent Trends: Shrinking Surplus Energy
Figure 3: Five-Year Energy Data Shows Diminished Surplus
Bar chart showing five-year average growth in total energy from 1974 to 2024, with blue bars for population growth and orange bars for per capita energy growth.
Figure 3 presents similar information as Figure 2 but uses five-year periods, based on data from the 2025 Statistical Review of World Energy. The most recent intervals, covering 2015 to 2024, show very small surpluses, indicating that the global economy is already feeling the strain of limited resources.
Diesel and Jet Fuel: Even Greater Constraints
Diesel and Jet Fuel Supplies Are Under Even More Pressure
Diesel and jet fuel, often grouped as “middle distillates,” are closely related and typically experience shortages together. These heavier oil products are vital for transportation and are produced in oil refineries.
Bar chart showing five-year average growth in diesel and jet fuel from 1974 to 2024, comparing population growth and per capita growth.
Figure 4 tracks the growth of these fuels over five-year periods. Since 2015, the availability of diesel and jet fuel per person has actually declined. Every five-year interval since 2000–2004 has seen slower growth in these fuels compared to overall energy supply.
This is particularly troubling because diesel and jet fuel are essential for global trade and food production. If these fuels are in short supply, international shipping and agriculture are directly impacted. While wind and solar are gaining popularity, they are not suitable replacements for these critical uses.

A map highlighting regions where limited diesel and jet fuel supplies are constraining trade, especially across major ocean routes.
Figure 5, created by the author, underscores the need for shorter trade routes in response to these fuel shortages.
Population Growth Outpacing Resources
Populations Are Growing Faster Than Resource Availability
One challenge rarely addressed by policymakers is that the world’s population is expanding beyond what current resources, including energy, can support. Often, energy statistics are presented without adjusting for population, which can give a misleadingly optimistic view. Figure 6 is an example of such a chart.

A line graph comparing the contributions of fossil fuels and alternative energy sources to global energy supply from 1965 to 2022.
Figure 6 demonstrates that recent additions to fossil fuel supplies are relatively minor. These alternatives, such as nuclear and renewables, depend on fossil fuels for their existence and would likely disappear if fossil fuels were eliminated. In 2024, wind and solar accounted for just 2.8% of the world’s energy supply.
Electricity: Growth and Limitations
Electricity Growth Appears Promising, but Challenges Remain
Figure 7 shows global electricity production by fuel type, but like Figure 6, it does not account for population size.

A chart tracking world electricity generation by source from 1985 to 2024, highlighting trends in fossil fuels, nuclear, hydro, and renewables.
- Electricity makes up only about 20% of total energy consumption, varying by region and year.
- Most non-fossil energy is in the form of electricity, with biofuels being a notable exception.
- Growth in electricity supply has occurred mainly outside the group of Advanced Economies (OECD members), with the most rapid increases following China’s WTO entry in 2001.

A line graph comparing electricity generation in developed and developing economies from 1985 to 2024.
Population growth since 1985 has also been concentrated in developing economies, as shown in Figure 9.

Bar chart illustrating the population growth in advanced and other economies from 1985 to 2024.
Declining Per Capita Electricity in Advanced Economies
Advanced Economies Face Falling Electricity Supply Per Person
In recent years, developed nations have experienced a drop in electricity production per capita, as depicted in Figure 10. While some of this decline is due to efficiency gains, much results from the relocation of industries to countries with lower labor costs.

Line graph showing per capita electricity production in five advanced economies from 1985 to 2024.
By contrast, per capita electricity output has generally risen in developing economies, as shown in Figure 11.

Line graph depicting per capita electricity production in selected developing economies from 1985 to 2024.
Despite differences among these countries, all four have seen growth in per capita electricity since 1999. By 2024, Saudi Arabia’s per capita electricity matched that of the US, and China’s surpassed both the EU and UK. Russia’s output began rising after its post-Soviet recovery around 1999.
Barriers to Further Electrification
Advanced Economies Face Obstacles in Expanding Electrification
Reducing reliance on fossil fuels requires more specialized minerals for advanced electrical technologies and transmission infrastructure. However, developed countries produce few of these minerals and depend heavily on imports. The US, for example, has identified a long list of critical minerals.

A chart listing 60 minerals considered critical by the USGS in 2025, including rare earth elements.
Some of these minerals are not rare in nature, but the lack of domestic industrial capacity—due to offshoring for cost and emissions reasons—limits production. For instance, the US was once a major aluminum producer, but now relies on imports, especially from China.
China dominates the production of many critical minerals. While advanced economies once planned to source these materials from global markets, supply is now lagging behind demand. In 2025, China imposed export restrictions on minerals like gallium, germanium, and antimony, highlighting the need for domestic production of essential resources such as silver, copper, platinum, rare earths, and uranium.
Mining these minerals often relies on diesel fuel, so shortages in diesel further complicate the situation. These challenges may explain renewed interest in resource-rich regions like Greenland.
Why These Issues Remain Underreported
Academic and Political Reluctance to Address Resource Constraints
Many economists fail to recognize how deeply the world economy is bound by physical limits. They often assume that higher prices will resolve shortages, but this is not always true—consumers can only buy what they can afford, and producers may not sustain output if prices are not reliably high. Shortages can lead to production shifting to lower-cost regions, resulting in greater inequality and fewer well-paying jobs in wealthier countries.
Politicians are hesitant to acknowledge unsolvable problems, and university leaders avoid alarming students and parents. As a result, the public rarely hears about these structural challenges.
The Musical Chairs Analogy: Not Enough to Go Around

A circle of red chairs, symbolizing the scarcity in a game of musical chairs.
In musical chairs, players compete for a limited number of seats, and each round leaves someone out. This metaphor captures today’s global competition for resources, explaining rising tensions, protectionism, and conflict.
Financial markets thrive during growth, but shortages of essential resources can stall progress, potentially leading to debt crises and market downturns. Political upheaval may follow, as representative governments require more energy than autocracies, and citizens may seek to replace leaders during times of disorder. However, these problems are systemic and not easily solved by changing leadership.
Globally, a shortage of well-paying jobs is a key issue. While economists expect high prices during shortages, the reality is that many people simply cannot afford available goods, leading to further confusion about the true nature of current economic challenges.
Major news outlets, influenced by advertisers, are unlikely to fully explain these issues. As a result, independent writers and bloggers play a crucial role in informing the public. I aim to provide regular updates to help readers understand the growing disruptions, such as tariffs and conflicts, that are emerging worldwide.
Disclaimer: The content of this article solely reflects the author's opinion and does not represent the platform in any capacity. This article is not intended to serve as a reference for making investment decisions.
You may also like
SEC Narrows Tron Case as Justin Sun Claims Are Dismissed
Bitcoin March Green: Market Turns Positive
Weekly review calendar week 10 – 2026
How does W.W. Grainger's stock fare in comparison to other companies in the industrial sector?