U.S. stock market wipeout, $805 billion claim fact check, S&P 500 market cap loss — data shows indexes fell on weaker growth and a firmer dollar. Method shown.

$805 billion claim fact check: no confirmed one-day wipeout
A circulating claim that “Over $805,000,000,000 [was] wiped out from the US stock market today” is not confirmed by major financial news outlets or recognized market data providers. In market parlance, “wiped out” generally refers to a change in aggregate market capitalization, not realized losses.
Large-dollar headlines often blend sector-only moves, multi-day totals, or rounded estimates into a single-session number. Without a date-stamped index move and a documented market-cap baseline, the precise $805 billion one-day figure remains unverified.
U.S. stock market wipeout: S&P 500 market cap loss drivers
Recent coverage has emphasized macro drivers that typically pressure equity valuations, including softer growth signals, interest-rate expectations, and a firmer dollar. the Dow fell about 800 points after signs of a weaker U.S. job market.
Separately highlighted was a risk mix spanning the labor backdrop, oil price moves, and conflict headlines, each of which can tighten financial conditions and curb risk appetite.
AP framed the selloff tone as a convergence of adverse macro signals before prices slid. “U.S. stocks are falling sharply Friday after getting a whiff of a worst-case scenario for financial markets: a weakening economy combined…” said Stan Choe, AP Business Writer.
Mechanically, when the S&P 500 (SPX) declines, its aggregate free-float market capitalization falls proportionally. The SPDR S&P 500 ETF Trust (SPY) mirrors that performance, offering a practical cross-check on the percentage move underpinning any market-cap estimate.
Related checks: verify market-cap math and crypto context signals
How to calculate one-day U.S. market-cap change via SPX/SPY
Identify the S&P 500’s end-of-day percentage change for the session using SPX. Multiply that percentage by the prior trading day’s aggregate S&P 500 free-float market capitalization to estimate the one-day change in value.
Cross-check the magnitude by comparing SPX’s move with SPY’s closing return for the same session. Match regular trading hours to avoid distortion from premarket or after-hours prints when comparing day-over-day changes.
To prevent misstatements, specify whether the figure covers only the S&P 500 or the broader market, and whether it’s a single session or a multi-day period. Clearly label the methodology and timestamp used in the calculation.
Bitcoin today: sentiment, volatility, and momentum signals
At the time of this writing, bitcoin (BTC) is near 68,274. Reported signals are Bearish sentiment, 3.15% (Medium) volatility, and 12 green days in the last 30 (40%), with RSI(14) around 51.50 (Neutral) and SMA50/SMA200 near 76,062/96,290.
A stronger dollar and shifting rate expectations have capped recent crypto rallies despite growing institutional participation; the outlet also described a session that erased roughly $110 billion across crypto assets, underscoring cross-market sensitivity.
Disclaimer: The content of this article solely reflects the author's opinion and does not represent the platform in any capacity. This article is not intended to serve as a reference for making investment decisions.
You may also like


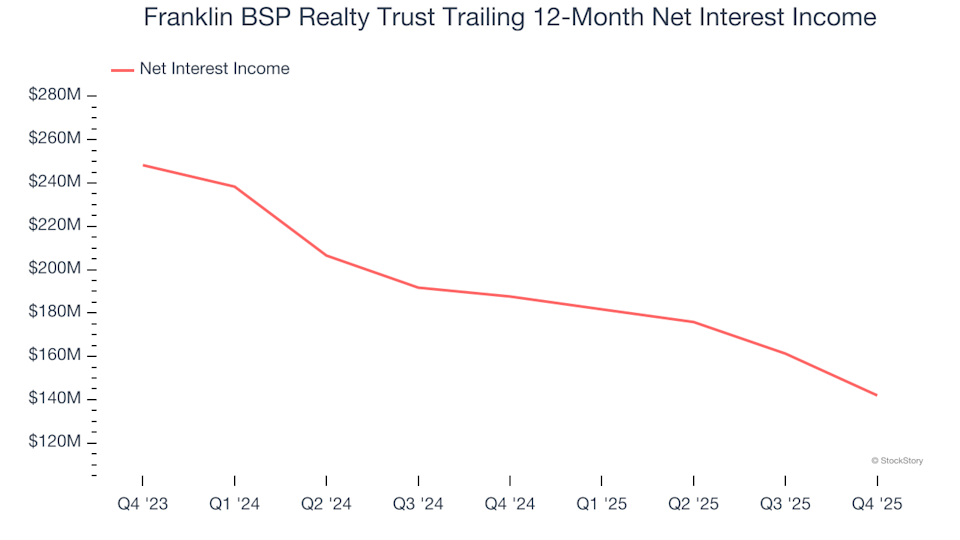
3 Reasons Why FBRT Carries Risk and One Alternative Stock Worth Considering
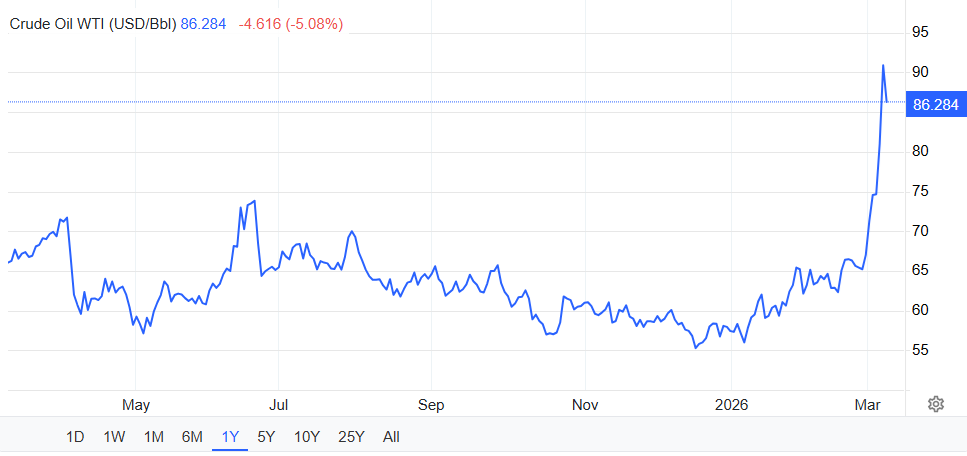
Oil is now the hottest topic on Crypto Twitter