Goldman’s $5,400 Gold Forecast Sparks Discussion: Why Those Holding DUST Should Pay Attention to the Underlying Dangers of Leverage Erosion

Gold’s Rally: A New Structural Era
Gold’s recent climb is more than a short-lived spike—it marks the beginning of a fundamental, long-term uptrend. This shift is being fueled by a transformation in both the types of buyers entering the market and their underlying motivations. Notably, Goldman Sachs has signaled this new phase by raising its price forecast for gold to $5,400 per ounce by the end of 2026. This isn’t a call for a temporary high, but rather an acknowledgment of a more resilient and lasting demand for gold.
According to Goldman Sachs, a new “debasement trade” is emerging, where investors are increasingly seeking protection against long-term fiscal and monetary uncertainties. This demand is now considered “sticky”—it is anchored in ongoing macroeconomic risks rather than short-term events. Evidence of this can be seen in the steady inflows into Western gold exchange-traded funds, which have accumulated approximately 500 tonnes since the start of 2025. This surge far exceeds what would be expected from interest rate cuts alone, indicating a broader, structural reallocation of capital.
Central banks are providing a solid foundation for this trend. Goldman Sachs projects that central banks will purchase an average of 60 tonnes of gold per month in 2026, a figure that greatly surpasses pre-2022 levels. This demand is especially robust, with China’s central bank extending its buying streak for 15 consecutive months through January. The move by emerging market reserve managers to diversify away from dollar-centric assets is a long-term strategy, not a short-term adjustment.
Ongoing geopolitical tensions further strengthen this structural case for gold. In late January, gold reached a new record high above $5,000 an ounce, propelled by global flashpoints from Greenland to the Middle East. This reinforces gold’s reputation as a safe haven during periods of uncertainty, adding another layer of support to its price. The current rally is thus underpinned by a combination of persistent investor demand, aggressive central bank accumulation, and a sustained “debasement trade,” all of which provide a strong base for the $5,400 target.
Implications for DUST: Leverage, Valuation, and Risks
The bullish case for gold has already materialized in the market, with spot prices hovering near $5,187 per ounce as of late February—close to Goldman Sachs’ year-end target. This suggests that much of the anticipated upside from structural demand and central bank buying is already reflected in current prices, making further near-term gains more challenging for the broader gold market.
MACD Crossover Long-only Strategy for DUST
- Entry: Buy when the 12-day EMA crosses above the 26-day EMA and the MACD (12,26,9) line moves above its signal line.
- Exit: Sell when the 12-day EMA drops below the 26-day EMA, after 15 trading days, or if a take-profit of +10% or a stop-loss of -6% is triggered.
- Backtest Period: Last 2 years
Risk Controls
- Take-Profit: 10%
- Stop-Loss: 6%
- Maximum Hold: 15 days
Backtest Results
- Strategy Return: -6.15%
- Annualized Return: -2.83%
- Maximum Drawdown: 11.99%
- Win Rate: 0%
- Total Trades: 1
- Winning Trades: 0
- Losing Trades: 1
- Average Hold Days: 10
- Max Consecutive Losses: 1
- Profit/Loss Ratio: 0
- Average Win Return: 0%
- Average Loss Return: 6.15%
- Largest Single Return: -6.15%
- Largest Single Loss: 6.15%
For those investing in leveraged products such as DUST, the landscape is more complicated. DUST aims to provide twice the daily performance of gold mining stocks, amplifying both gains and losses. However, this leverage introduces significant risk, especially if gold’s momentum wanes. Because the fund must rebalance daily to maintain its leverage, its net asset value (NAV) can diverge sharply from gold’s actual price movements. For example, in late January, DUST’s NAV dropped 7.47% in a single day even as gold prices surged, highlighting how volatility can erode returns over time.
DUST’s valuation is influenced by both gold’s price and the volatility of gold mining stocks. The fund’s expense ratio of 0.93% is a constant drag on returns, and its performance over the past year has been poor, with an 88.72% loss year-to-date. This underscores the double-edged nature of leverage: while it can magnify gains during strong rallies, it can also lead to steep losses during corrections or sideways markets. A key risk for DUST holders is that the fund’s NAV may become disconnected from gold’s long-term trend, making it unsuitable for simply betting on gold’s sustained rise.
In essence, DUST is a speculative, high-risk tool. It is not a straightforward play on gold reaching $5,400, but rather a leveraged bet on the volatility and momentum of gold miners. Investors who are confident in the macro gold narrative can use DUST for amplified exposure, but they must be prepared for significant daily swings and understand that compounding decay can result in long-term losses even if gold itself performs well.
Key Drivers and Risks for Gold Miners
For gold miners to outperform over the long term, the underlying structural demand for gold must persist. The main catalyst is the continuation of strong, stable demand—particularly from central banks and the ongoing “debasement trade” that Goldman Sachs expects to remain robust through 2026. The bank anticipates official sector purchases averaging 60 tonnes per month this year, well above historical norms. This represents a lasting shift, as emerging market reserve managers diversify away from dollar-heavy assets. As long as this conviction-driven buying continues, it should provide a solid floor for gold prices and support higher margins and output for miners.
However, a major risk is the potential for leverage decay. If gold’s upward momentum slows, losses in leveraged funds like DUST can accelerate, regardless of gold’s actual performance. This was evident in late January, when DUST’s NAV dropped 7.47% in a single day despite a rally in gold. Such volatility can cause the fund’s NAV to diverge from gold’s long-term trend, making it a risky vehicle for those seeking to benefit from gold’s structural rise. Investors should be aware that leveraged miner products are prone to sharp daily swings and that their long-term returns may lag behind gold due to compounding losses.
Ultimately, the performance ceiling for gold mining stocks is set by the broader macroeconomic environment that determines gold’s price range. Investors should pay close attention to real interest rates and the strength of the U.S. dollar, as these are the primary forces shaping gold’s long-term value. While the current narrative of structural demand is a strong tailwind, it operates within these larger economic cycles. Any significant change in real rates or a sustained rally in the dollar could limit the upside for miners, even if gold’s fundamental demand remains robust. The outlook is shaped by powerful catalysts but tempered by persistent macro risks.
Disclaimer: The content of this article solely reflects the author's opinion and does not represent the platform in any capacity. This article is not intended to serve as a reference for making investment decisions.
You may also like


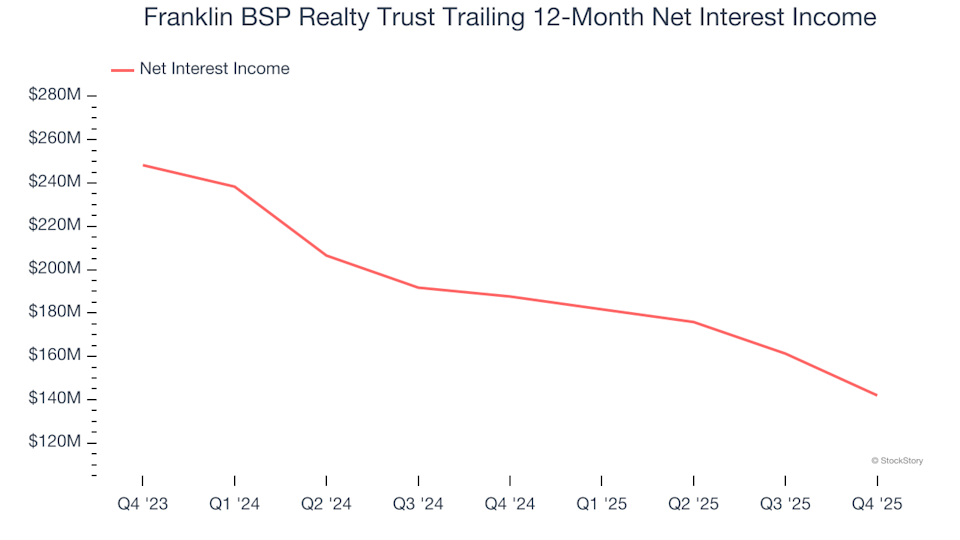
3 Reasons Why FBRT Carries Risk and One Alternative Stock Worth Considering
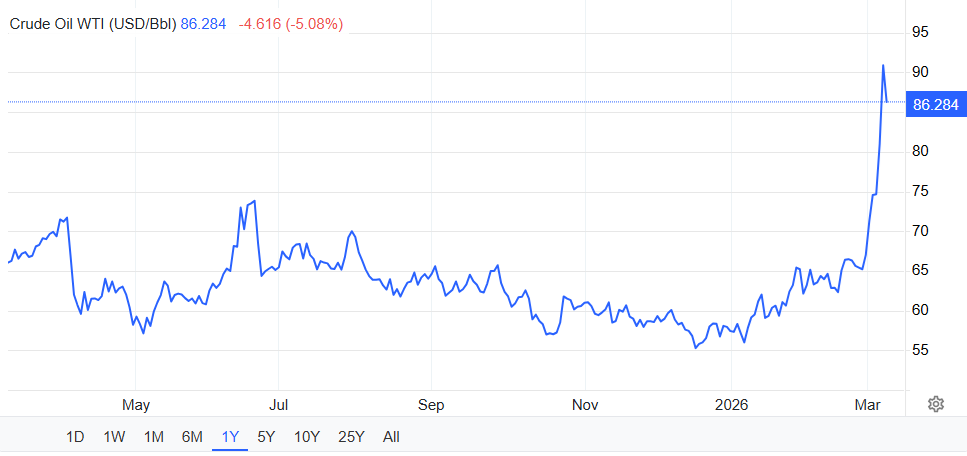
Oil is now the hottest topic on Crypto Twitter