
Today's Bullish Patterns & Technical Sentiment | Published on 03/10: APGE, PTGX, BRZE and More

Today's List
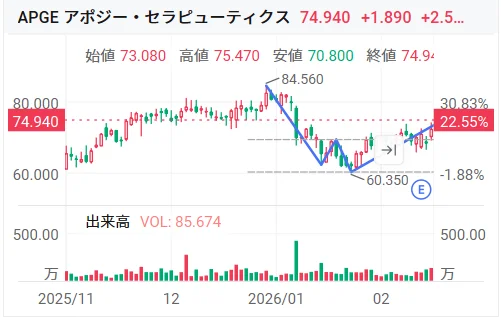
$Apogee Therapeutics (APGE.US)$ climbed 2.59% in the last session. The 20-day average turnover is $59.17M, indicating active trading. Indicators suggest an Overbought condition with strong sentiment. Watch for selling pressure near $78.82, with $74.05 serving as the pullback support reference.
Date Identified: 2026/02/25
 Pattern: Double Bottom
Probability: 84.57%
Return Since Signal: 5.71%
Indicator Status: Overbought
Resistance: $78.82
Support: $74.05
Signal Status: New Entry
* Past performance is not indicative of future results.
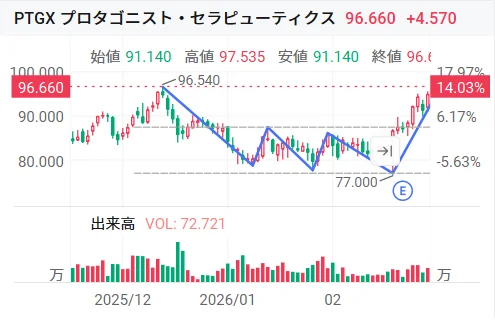
$Protagonist Therapeutics (PTGX.US)$ edged higher 4.96% in the last session. The 20-day average turnover is $49.35M, indicating active trading. Indicators suggest an Overbought condition with strong sentiment. Watch for selling pressure near $102.50, with $95.48 serving as the pullback support reference.
Date Identified: 2026/02/27
Pattern: Triple Bottom
Probability: 85.86%
Return Since Signal: 4.97%
Indicator Status: Overbought
Resistance: $102.50
Support: $95.48
Signal Status: Active
* Past performance is not indicative of future results.
$Braze (BRZE.US)$ fell 0.62% in the last session. The 20-day average turnover is $58.61M, indicating active trading. Indicators suggest an Overbought condition with strong sentiment. Watch for selling pressure near $21.09, with $19.53 serving as the pullback support reference.
Date Identified: 2026/03/04
Pattern: Bullish Continuation Wedge
Probability: 72.63%
Return Since Signal: 3.38%
Indicator Status: Overbought
Resistance: $21.09
Support: $19.53
Signal Status: New Entry
* Past performance is not indicative of future results.
$Four Corners Property Trust Inc (FCPT.US)$ fell 0.04% in the last session. The 20-day average turnover is $21.91M, indicating active trading. Indicators suggest an Overbought condition with strong sentiment. Watch for selling pressure near $26.41, with $25.56 serving as the pullback support reference.
Date Identified: 2026/02/27
Pattern: Bullish Continuation Triangle
Probability: 90.99%
Return Since Signal: 0.58%
Indicator Status: Overbought
Resistance: $26.41
Support: $25.56
Signal Status: New Entry
* Past performance is not indicative of future results.
$MDU Resources (MDU.US)$ climbed 1.76% in the last session. The 20-day average turnover is $35.09M, indicating active trading. Indicators suggest an Overbought condition with strong sentiment. Watch for selling pressure near $22.26, with $21.14 serving as the pullback support reference.
Date Identified: 2026/03/05
Pattern: Bullish Continuation Triangle
Probability: 85.85%
Return Since Signal: 0.37%
Indicator Status: Overbought
Resistance: $22.26
Support: $21.14
Signal Status: New Entry
* Past performance is not indicative of future results.
More Inclusions
$Rogers Communications (RCI.US)$
$NetScout Systems (NTCT.US)$
$Cal-Maine Foods (CALM.US)$
$Nexstar Media Group (NXST.US)$
Removals
$CNX Resources Corp (CNX.US)$
$DocuSign (DOCU.US)$
Disclaimer: The content of this article solely reflects the author's opinion and does not represent the platform in any capacity. This article is not intended to serve as a reference for making investment decisions.
You may also like
Marvell's Big Earnings Win Could Be the Start of Something Bigger

Dogecoin Price Rebound Triggers 779% in Liquidation Imbalance

Brazil's Frigol targets 60% beef output jump with slaughterhouse deals
Alibaba AI Agent ROME Runs Unauthorized Crypto Mining During Training