
AAPL (H1): Is The Pullback Complete Or More Downside First?

By:TradingView
In my previous analysis, I outlined the idea that AAPL was undergoing a pullback within a larger impulsive structure. The expectation was that the move could develop as a corrective sequence before the next upside continuation.
To better understand the internal structure of this correction, I have now zoomed into the H1 timeframe.
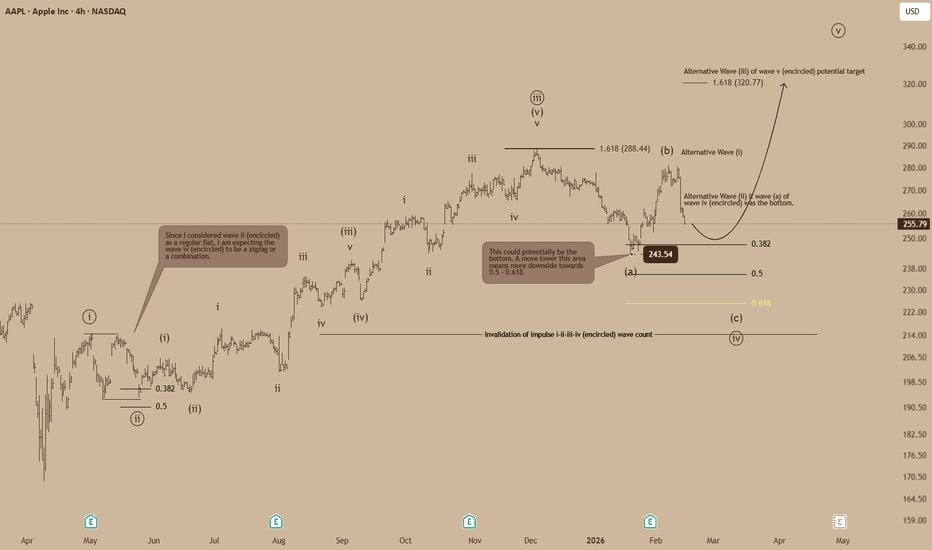
From this lower timeframe perspective, the decline appears to be unfolding as a corrective sequence approaching the 243.54 region, which sits near the 0.382 retracement of the larger move. This level becomes an important reaction zone.
If price finds support and bounces above 243.54, the bullish scenario remains intact, suggesting that this area may represent the completion of wave (a) or wave v of the correction, potentially leading into the next impulsive move higher.
However, if price breaks decisively below this support, the correction may not yet be complete. In that case, the structure could extend toward deeper retracement levels around 0.5 – 0.618, before the larger bullish structure resumes.
For now, the key level to monitor remains 243.54, as the market reaction here will likely determine whether the pullback has completed or if further downside is required.
To better understand the internal structure of this correction, I have now zoomed into the H1 timeframe.
From this lower timeframe perspective, the decline appears to be unfolding as a corrective sequence approaching the 243.54 region, which sits near the 0.382 retracement of the larger move. This level becomes an important reaction zone.
If price finds support and bounces above 243.54, the bullish scenario remains intact, suggesting that this area may represent the completion of wave (a) or wave v of the correction, potentially leading into the next impulsive move higher.
However, if price breaks decisively below this support, the correction may not yet be complete. In that case, the structure could extend toward deeper retracement levels around 0.5 – 0.618, before the larger bullish structure resumes.
For now, the key level to monitor remains 243.54, as the market reaction here will likely determine whether the pullback has completed or if further downside is required.
0
0
Disclaimer: The content of this article solely reflects the author's opinion and does not represent the platform in any capacity. This article is not intended to serve as a reference for making investment decisions.
Understand the market, then trade.
Bitget offers one-stop trading for cryptocurrencies, stocks, and gold.
Trade now!
You may also like
1 Services Stock for Long-Term Investors and 2 We Brush Off
101 finance•2026/03/11 16:10
HUF: Disinflation supports dovish MNB without hurting forint – Commerzbank
101 finance•2026/03/11 16:06
French President Macron: Government may decide further measures to cushion oil prices
101 finance•2026/03/11 16:06
Trending news
MoreCrypto prices
MoreBitcoin
BTC
$70,389.98
-0.92%
Ethereum
ETH
$2,051.68
-0.93%
Tether USDt
USDT
$1
-0.03%
BNB
BNB
$646.41
-0.25%
XRP
XRP
$1.38
-2.99%
USDC
USDC
$1.0000
-0.01%
Solana
SOL
$85.59
-2.50%
TRON
TRX
$0.2905
+2.17%
Dogecoin
DOGE
$0.09250
-6.33%
Cardano
ADA
$0.2625
-2.74%
How to buy BTC
Bitget lists BTC – Buy or sell BTC quickly on Bitget!
Trade now
Become a trader now?A welcome pack worth 6200 USDT for new users!
Sign up now