
Small Caps Options Traders Should See This Chart

Small caps have understandably taken the brunt of the broad market selloff, as investors deviate from their risk-on appetite toward growth stocks. But despite current options trends, the iShares Russell 2000 ETF (IWM) is proving to be more resilient than some exchange-traded funds (ETFs) out there.
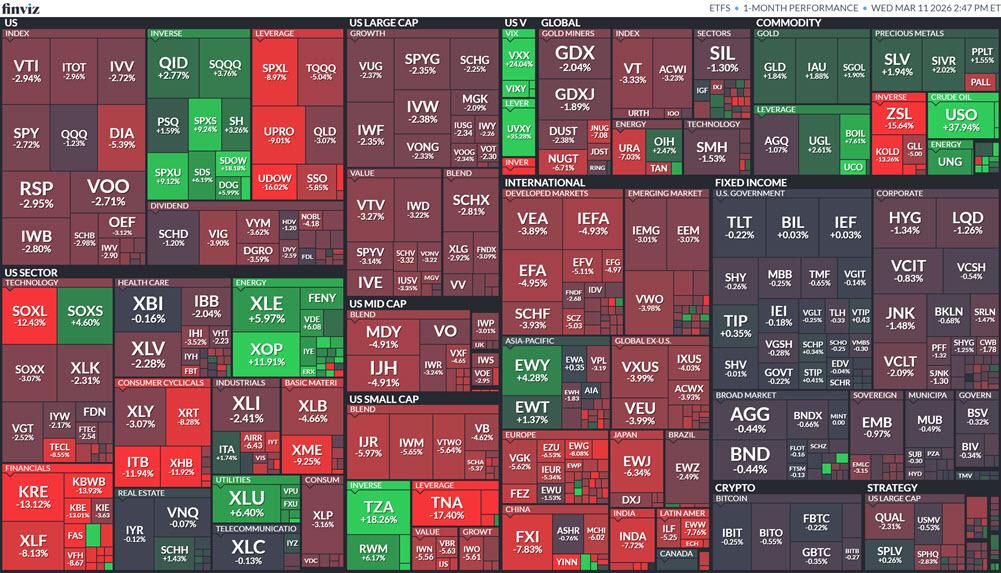
IWM is trading at $251.88, down 0.6% at last check. The ETF has shed 3.8% in the last 30 days, barely holding its year-to-date breakeven level. However, per the chart below, there are far worse performers in the last 30 days, including semiconductors, Financial Select Sector SPDR Fund (XLF), and overseas ETFs.
There’s a tremendous amount of pessimism around IWM, though, from an options perspective. Speculative players have been buying to open puts at a quicker-than-usual clip relative to calls. At the International Securities Exchange (ISE), Chicago Board Options Exchange (CBOE), and NASDAQ OMX PHLX (PHLX), the stock’s 10-day put/call volume ratio of 1.72 ranks in the 80th percentile of its annual range.
Despite the put skew, IWM has chart support at its 126-day moving average, an area that roughly coincides with the round $250 level. Should this area hold and small caps enjoy a resurgence, an unwinding of those bearish bets could push IWM back to its Jan. 22 all-time high of $271.59.

Disclaimer: The content of this article solely reflects the author's opinion and does not represent the platform in any capacity. This article is not intended to serve as a reference for making investment decisions.
You may also like
Why Comcast (CMCSA) Fell More Sharply Than the Overall Market Today
Coupang, Inc. (CPNG) Falls Further Than the Overall Market: What Investors Should Know
CRISPR Therapeutics AG (CRSP) Falls Sharper Than Overall Market: Key Information to Note
Pilgrim's Pride (PPC) Falls Sharper Than Overall Market: What Investors Should Know