cryptoticker.io
$XRP Price Prediction: Why the $2.00 Level is the Next Major Target
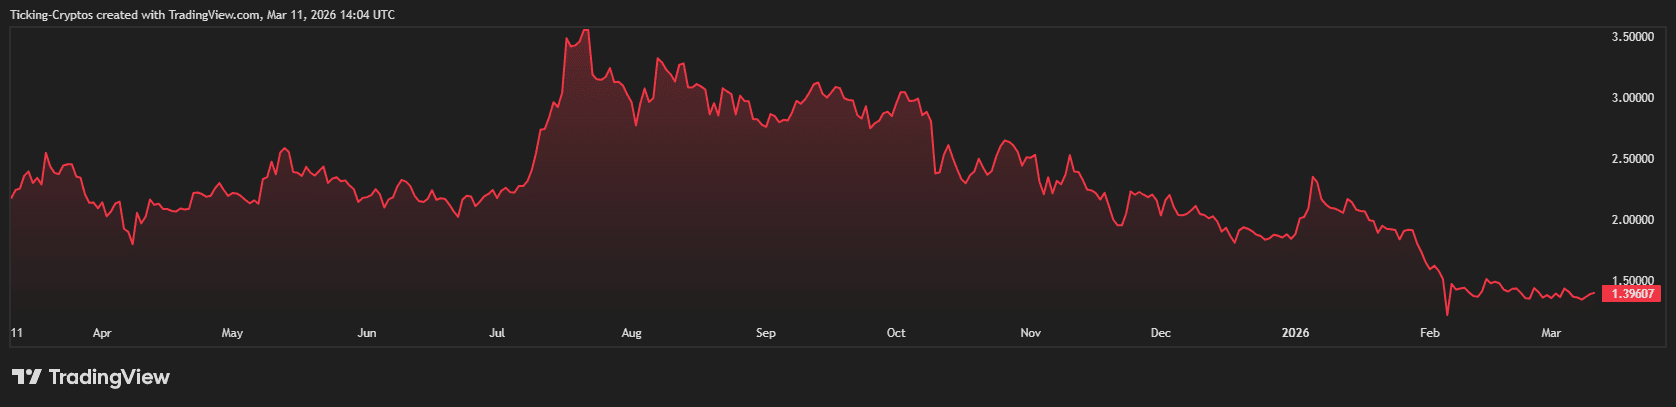
Current market data suggests that a return to the $2 level is a high-probability target supported by record-low exchange liquidity, massive spot ETF inflows, and the integration of the $XRP Ledger into global financial infrastructure. As of March 11, 2026, $XRP is trading in a "coil" formation that often precedes a violent breakout. Breaking above the 200-day Moving Average is the technical trigger required to turn this psychological resistance into a launchpad for further gains.
Understanding $XRP Liquidity Magnets and Market Structure
To understand the $2 target, one must look at market structure and liquidity magnets. In trading, a "liquidity magnet" refers to a price zone where a large cluster of orders (often liquidations) resides. For $XRP, the $2.00 to $2.20 range represents a massive area of short-position liquidations. If the price of $XRP moves into this zone, a "short squeeze" could rapidly accelerate the rally beyond previous resistance levels.
1. Institutional Infrastructure: The Ripple Prime Effect
The most significant fundamental driver for $XRP in 2026 is its transition from a speculative asset to a core piece of financial infrastructure. Following its acquisition of several fintech firms in 2025, Ripple has launched Ripple Prime, a unified institutional platform.
On March 2, 2026, it was revealed that Ripple Prime's integration with major clearing houses has begun routing institutional post-trade volumes directly onto the $XRP Ledger. This provides a fundamental "floor" for the price as the network begins processing real-world transaction volume rather than just retail speculation.
2. Institutional Inflows via Spot $XRP ETFs
Since the landmark approval of Spot $XRP ETFs, institutional adoption has accelerated. As of this week, $XRP ETFs have surpassed $1.44 billion in cumulative inflows. Notably, banking giants like Goldman Sachs have emerged as top holders, signaling that the "smart money" is positioning for long-term appreciation.
According to recent reports from Nasdaq, the elimination of the SEC legal overhang in late 2025 allowed conservative wealth managers to finally include $XRP in their digital asset portfolios. This persistent buying effectively reduces the circulating supply on exchanges, creating a supply-demand imbalance that favors the bulls.
3. Technical Breakout and Symmetrical Triangle Compression
From a technical standpoint, $XRP is currently testing the apex of a massive symmetrical triangle on the daily chart. Historically, such compressions lead to significant price expansions.
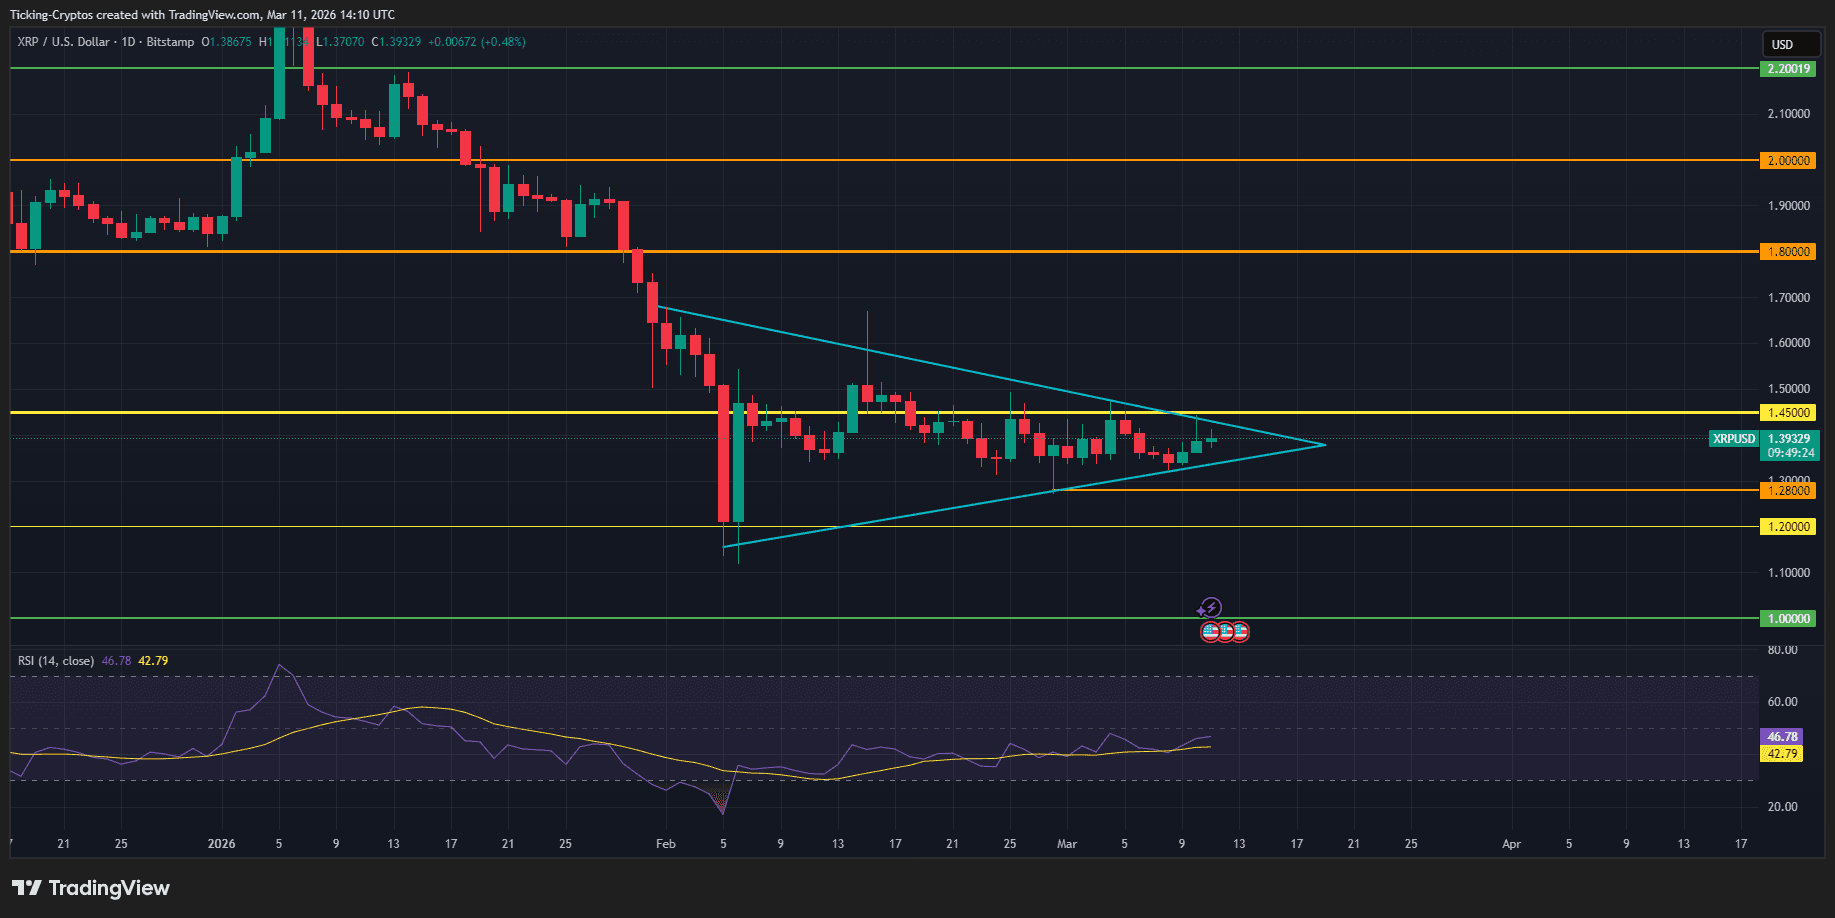
- RSI Bullish Divergence: While price has stayed flat, the Relative Strength Index (RSI) is making higher lows, suggesting hidden strength.
- Exchange Balances: $XRP held on centralized exchanges has hit a 3-year low, according to CryptoQuant data.
- Network Activity: The $XRP Ledger recently hit 2.7 million daily transactions, a record high that proves network utility is outpacing price action.
$XRP Resistance Levels and Support Zones for 2026
To track the progress toward the $2 target, investors should monitor the following support and resistance zones:
| Immediate Support | $1.30 | Critical floor; must hold to maintain bull bias |
| Local Resistance | $1.50 | Major psychological hurdle for retail traders |
| The Bull Target | $2.00 | Breakout confirmation & short-squeeze trigger |
| Cycle Peak Target | $3.80+ | Previous All-Time High (ATH) retest |
$XRP Future Outlook: The Impact of the Digital Asset Market Clarity Act
While the path to $2 seems clear, investors must remain aware of broader macro risks. The upcoming US Digital Asset Market Clarity Act vote later this month will be the final piece of the puzzle. A "Yes" vote would provide the ultimate regulatory green light, likely triggering the final surge past $2.00.