
The "inflation bomb" of soaring oil prices has been ignited, US Treasury yields are approaching a critical level—will gold be caught in the crossfire?

Huitong Network, March 12—— On Thursday (March 12), in the current global financial market, movements in US Treasury yields have become the core driving force behind pricing logic. The market is exhibiting a highly complex “stagflation-style” pricing pattern. Under the dual impact of the strong “stickiness” shown by US February CPI inflation data and the sharply deteriorating geopolitical situation in the Middle East, the US Dollar Index (DXY) and Treasury yields are rising in tandem, creating a structural situation for traditional safe-haven asset spot gold where both suppression and support coexist.
On Thursday (March 12), in the current global financial market, movements in US Treasury yields have become the core driver of pricing logic. The market is showing an extremely complex “stagflation-style” pricing characteristic. Influenced by the strong “stickiness” demonstrated in the US February CPI inflation data and the rapidly escalating geopolitical tensions in the Middle East, the US Dollar Index (DXY) and US Treasury yields are climbing together, creating a structural scenario where both suppressive and supportive forces are simultaneously acting upon traditional safe-haven asset spot gold.
As US core inflation failed to slow significantly as expected, reputable institutions have generally downgraded their expectations for a Federal Reserve rate cut in the near future, and the market currently prices in almost zero probability for a rate cut in March. These expectations for a “higher for longer” interest rate path have directly pushed 10-year Treasury yields to break higher, while also providing a firm interest rate differential support for the US dollar. However, the escalation of shipping safety risks in the Persian Gulf has led to drastic oil price volatility, further intensifying inflation concerns and stimulating safe-haven demand for physical assets.
Analyzing the US Dollar’s Trend from the Treasury Perspective: Dual Drives of Rate Premium and Inflation Expectations
The current strong performance of the dollar is essentially an extension of the US Treasury market’s pricing of macro data and geopolitical risk.
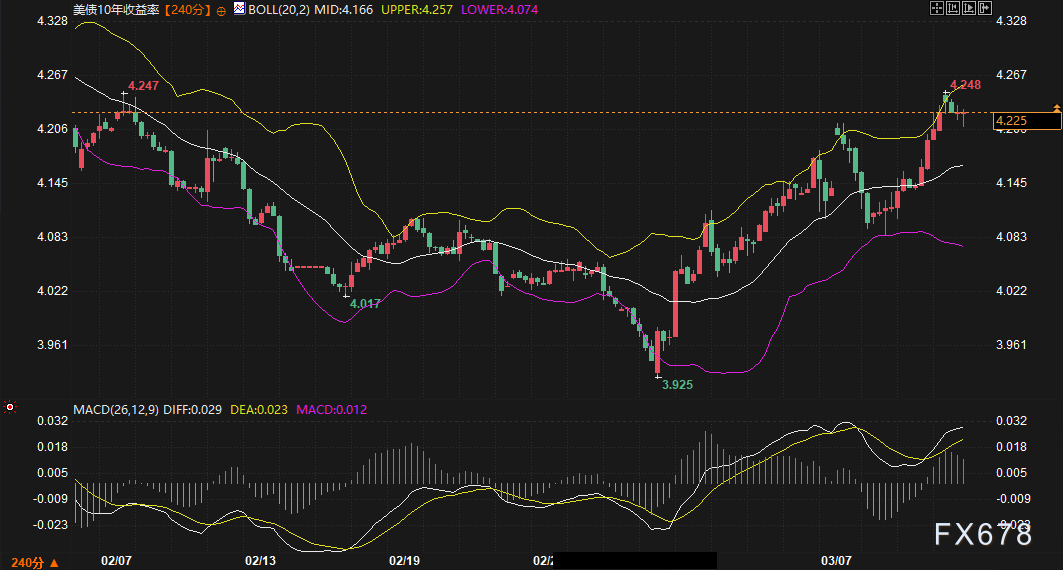
The release of US February CPI was the catalyst for this round of volatility. Data showed inflation pressure remained robust, sending the 10-year Treasury yield quickly up from 4.207% to around 4.228%. Meanwhile, the US labor market demonstrated strong resilience, with weekly initial jobless claims unexpectedly dropping to 213,000, lower than market expectations. Such strong economic fundamentals support interest rate expectations and give the dollar an advantage in interest rate differential games against other currencies. Additionally, rising energy prices are feeding inflation expectations into the bond market, further pushing up nominal Treasury yields and driving the DXY to maintain a choppy yet strong tone near highs.
On the 240-minute level, the DXY is now operating near 99.4723, with price hugging the upper Bollinger Band. While the MACD’s red histogram continues to show upward momentum, the slowing slope suggests some risk of high-level stalling.
Resistance zone forecast: Key resistance above lies at the previous high of 99.6950 and the upper Bollinger Band near 99.68. A clear breakout above this zone would open space for the USD to shoot for the psychological 100-round number.
Support zone forecast: Primary support sits at the Bollinger midline of 99.06, with further support at the previous low of 98.44.
Intraday focus: Beware of pullback pressure after short-term high-level oscillation, especially if US Treasury yields show signs of running out of steam.
Gold Analysis: The Tug-of-War Between Risk Aversion Transmission from Bonds and Yield Suppression
Gold’s current trend is at a balancing point between “geopolitical risk premium” and “US Treasury yield suppression”.
The escalation in the Middle East is the core support for gold’s resilience. Maritime data shows seven vessels were attacked in the Persian Gulf within 24 hours, and an attack near Jebel Ali marked a sharp temperature rise in the situation. Such extreme risk aversion sentiment usually directly lifts gold prices. However, what’s unique this round is that geopolitical risk is also driving oil prices higher (once breaking $100/barrel), thus boosting inflation expectations and Treasury yields. Since Treasury yields represent the opportunity cost of holding gold, their rise has created a distinct “ceiling” effect on gold. As a result, gold is displaying a pattern of high-level oscillatory correction, rather than a one-sided surge.
Spot gold is currently quoted at $5185.17, positioned between the 4-hour Bollinger Band midline ($5169) and upper band ($5248). The MACD shows the DIFF line dipping slightly below the DEA line, indicating a slight weakening of short-term bullish momentum as bulls and bears fiercely compete near the $5200 mark.
Resistance zone forecast: Focus above on $5248 (Bollinger upper band) and the previous high of $5419.
Support zone forecast: Initial support is at the Bollinger midline $5169, a break of which could see a drop to the $4996–$5091 (Bollinger lower band) range.
Intraday focus: Closely track oil price volatility’s impact on the bond market. If Treasury yields spin out of control due to overheated inflation expectations, gold may experience wide swings due to real yield changes.
Looking Ahead: Bond Market Pricing Logic Will Dominate the Next 2-3 Sessions
Looking out to the next 2-3 trading days, the main theme will remain “bond market pricing”. With no public remarks from Fed officials in the short term, the market will rely heavily on real-time external events.
Firstly, whether the 10-year Treasury yield can stabilize above the 4.25% threshold is crucial. From the current value of 4.225, there is still room to rise technically. Should yields continue upward, the dollar will maintain its hegemony, while gold may face pullback pressure once safe-haven buying dries up. Secondly, unexpected geopolitical headlines remain the biggest variable. Any deep concerns about energy supply chain disruption will reinforce gold’s bottoming configuration.
Overall, the market is experiencing a transition from “policy expectation-driven” to “risk premium-driven”. The extreme case of simultaneous gains in USD and gold may appear intermittently in the coming days, but this typically signals a rapid surge in volatility. Investors should closely monitor touches of the Bollinger Band’s upper and lower bounds, and watch whether the MACD shows an obvious top divergence signal at high levels.
【Frequently Asked Questions】
A: The key is that the market focuses not just on whether data is a “blow-out”, but on “stickiness” of inflation. The February CPI report showed core inflation remains persistent, shattering hopes for Fed rate cuts in March or April. As rate-cut expectations get pushed back, the interest rate premium on Treasuries rises once again. Since Treasury yields are the cornerstone of USD pricing, higher yields naturally attract capital back to USD assets, pushing the Dollar Index higher.
A: This is the “bond market transmission effect” focused on in the analysis above. Geopolitics do attract safe-haven buying, but at the same time, they drive oil prices up, which in turn boost inflation expectations and thus Treasury yields. As a non-yielding asset, gold is capped when Treasury yields (the opportunity cost of holding gold) rise. Currently, gold is experiencing the offsetting forces of risk aversion “push” and high-yield-driven “pull”, resulting in high-level range-bound behavior.
A: On the 240-minute chart, DXY is tightly hugging the upper Bollinger Band. The MACD’s red bars (while persistent) are flattening, which indeed suggests stalling at highs. However, as long as the 10-year Treasury yield remains above 4.2%, any USD pullback will likely be limited. Unless economic data disappoints or there is a dramatic de-escalation in geopolitics, the USD is likely to persist in strong consolidation at elevated levels in the near term.
A: It’s a multi-layered transmission: Rising oil prices → higher costs for companies and households → higher inflation expectations → investors demand higher Treasury yields as compensation → Treasury prices fall/yields rise. As Treasury yields are the anchor for global asset pricing, this process quickly impacts both the USD (strengthening) and gold (cost pressure). In this analysis, oil’s disturbance to bonds is the key to understanding the linkage among all three.
A: The most crucial “weather vane” is the 4.25% resistance of the 10-year Treasury yield. If yields break above this level, the market will be pricing for longer-term inflation risks, and the USD may move higher. Conversely, if yields are capped and pull back at the Bollinger upper bound, gold could get a respite and launch a fresh upward attempt.
Disclaimer: The content of this article solely reflects the author's opinion and does not represent the platform in any capacity. This article is not intended to serve as a reference for making investment decisions.
You may also like
OGN (OriginProtocol) fluctuates 79.2% in 24 hours: Driven by protocol buybacks and on-chain whale activity