ACDC Jumps 17.4%: ProFrac Holding Captures Attention – What’s Driving This Market Turbulence?

ProFrac Holding (ACDC) Sees Sharp Intraday Rally
Key Highlights
- ProFrac Holding (NASDAQ: ACDC) soared by 17.4% during the session, climbing from an opening price of $5.94 to $6.88.
- The stock is trading close to its 52-week peak of $10.70, with a negative price-to-earnings ratio of -4.05.
- Options activity has intensified, particularly on the $7 call contracts expiring March 20, which have seen significant volume.
- Short-term technicals are bullish, while the longer-term trend remains range-bound, prompting traders to closely monitor the situation. The rapid price spike has sparked speculation about potential catalysts and the implications of the options market's activity.
Technical Strength Fuels ACDC’s Upward Momentum
The dramatic surge in ACDC has been underpinned by a strong short-term uptrend and notable accumulation in call options. The stock broke through the upper Bollinger Band at $5.87, reaching as high as $6.90. Such a substantial single-day gain points to robust buying, possibly from institutional investors. Technical indicators reinforce the bullish case: the RSI stands at 56, and the MACD is positive at 0.156 with a bullish histogram, signaling continued momentum. This breakout comes after a prolonged period of range-bound trading over the past year.
Sector Comparison: ACDC Outpaces Peers
While ACDC has rallied sharply, sector heavyweight Halliburton (HAL) has lagged, posting a 1.59% decline on the day. This divergence suggests that ACDC’s move is driven by company-specific factors rather than a broad sector rally. The surge in both price and options activity indicates heightened speculative interest in ACDC, even as the broader oil and gas equipment sector remains subdued.
Options Strategies: Leveraging ACDC’s Breakout
- MACD: 0.156 (Bullish), Signal Line: 0.1095 (Rising), Histogram: 0.0465 (Bullish Divergence)
- RSI: 56.0 (Neutral to Slightly Overbought) – Potential for further gains
- 200-Day Moving Average: $5.308 – Current price well above this level, confirming a breakout
- Bollinger Bands: Upper band at $5.87 – Price has exceeded this threshold
- Support/Resistance: Key levels at $5.03 (30-day support) and $3.92 (200-day support)
- Turnover Rate: 2.28% – Typical for the stock, but participation is increasing
With technicals pointing to a strong breakout, traders are eyeing leveraged options to ride the momentum. Two notable contracts include:
-
ACDC20260320C7 (Call Option)
- Strike Price: $7
- Expiration: March 20, 2026
- Implied Volatility: 76.22% (Moderate to High)
- Delta: 0.5556 (Moderate Sensitivity)
- Theta: -0.0352 (Significant Time Decay)
- Gamma: 0.4675 (Very High Sensitivity to Price Changes)
- Leverage Ratio: 19.08% (Moderate)
- Turnover: 2,533 (High Liquidity)
- Price Change Ratio: 117.65% (Strong Recent Performance)
- This contract is attractive for short-term bullish plays, offering a balance between leverage and volatility with ample liquidity.
-
ACDC20260417C7 (Call Option)
- Strike Price: $7
- Expiration: April 17, 2026
- Implied Volatility: 73.58% (Moderate)
- Delta: 0.5682 (Moderate Sensitivity)
- Theta: -0.0126 (Moderate Time Decay)
- Gamma: 0.2377 (High Sensitivity)
- Leverage Ratio: 10.09% (Moderate)
- Turnover: 44,943 (Extremely High Liquidity)
- Price Change Ratio: 131.43% (Strong Recent Performance)
- This option is well-suited for those seeking to maintain a bullish stance with a longer time horizon, thanks to its high liquidity and gamma.
If ACDC rises 5% from its current price of $6.88 to approximately $7.22, both contracts would have an intrinsic value of $0.22. With leverage ratios of 19.08% and 10.09%, these options could deliver amplified returns if the stock continues its upward trajectory toward its 52-week high.
Historical Performance Review
Looking at the ACDC ETF’s past performance, the largest single-day gain since 2022 has been 17%. However, over longer periods, the ETF has struggled, with win rates between 42.54% and 48.26% over 3, 10, and 30-day spans, and returns ranging from -0.44% to -1.64%. This suggests that while short-term rallies have occurred, sustained outperformance has been elusive.
Strategic Considerations: Proceed with Caution as ACDC Approaches $7.00
The recent 17.4% jump has brought ACDC to a pivotal level. Technical signals remain positive, with the price above both the 200-day moving average and the upper Bollinger Band, indicating that momentum could persist. However, the stock is still trading well below its 52-week high of $10.70, and volatility remains elevated. Aggressive investors may consider the highlighted call options for leveraged exposure, but should watch for a decisive move above $7.00 and monitor sector trends, especially as Halliburton’s decline signals possible divergence. If ACDC can maintain levels above $6.50, it may mark a shift in sentiment for the broader oil and gas equipment industry. For those anticipating a larger rally, now may be the time to act.
Disclaimer: The content of this article solely reflects the author's opinion and does not represent the platform in any capacity. This article is not intended to serve as a reference for making investment decisions.
You may also like
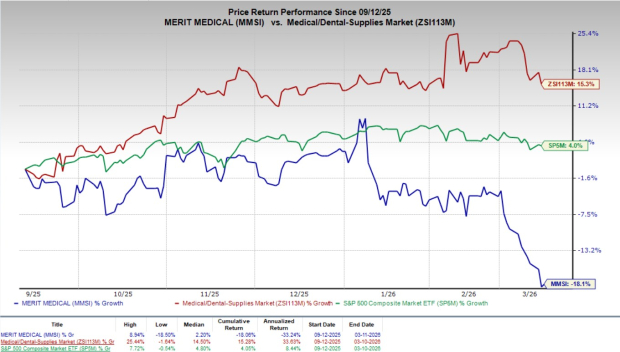
Here’s Why Including Merit Medical Shares in Your Investment Portfolio Makes Sense Now
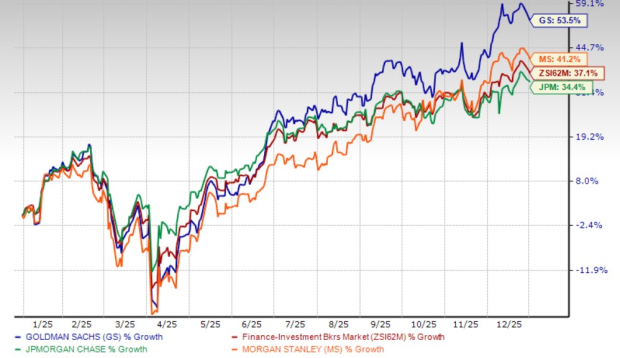
Is It Still a Good Idea to Invest in Goldman Stock After a 53.5% Surge in 2025?
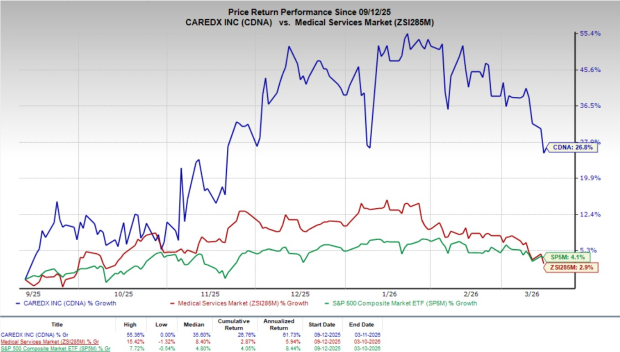
CareDx Launches VANTx AI Solution for Advanced Transplant Data Analysis