
First Bullish Wick Appears On XRP Weekly Chart, And This Analyst Says It Will Send Price To $21.5

By:Newsbtc
Bitget offers a variety of ways to buy or sell popular cryptocurrencies.Buy now!
A welcome pack worth 6200 USDT for new users!Sign up now!
A lone green candle on XRP’s three-week chart is drawing attention from at least one analyst who believes it could be the start of something bigger than a routine bounce.
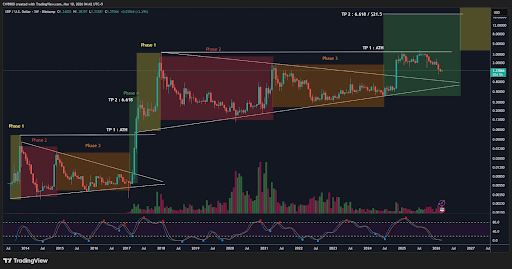
Crypto analyst CW, posting on X, flagged a bullish candlestick formation on the XRP/USD 3W chart that he says signals the opening of a full-scale uptrend. One that, if his cycle analysis holds, with the setup pointing first to a retest of the all-time high zone and then, in an extreme scenario, to $21.5.
New Uptrend Is Starting On The 3-Week Chart
Technical analysis of XRP’s price action on the 3-week candlestick timeframe chart is revealing an interesting signal. The signal itself is straightforward: a green candlestick has been printed on XRP’s three-week chart at a time when the price is sitting just above $1.38.
var rnd = window.rnd || Math.floor(Math.random()*10e6); var pid607465 = window.pid607465 || rnd; var plc607465 = window.plc607465 || 0; var abkw = window.abkw || ''; var absrc = 'https://servedbyadbutler.com/adserve/;ID=172179;size=0x0;setID=607465;type=js;sw='+screen.width+';sh='+screen.height+';spr='+window.devicePixelRatio+';kw='+abkw+';pid='+pid607465+';place='+(plc607465++)+';rnd='+rnd+';click=CLICK_MACRO_PLACEHOLDER'; document.write('
');
if (!window.AdButler){(function(){var s = document.createElement("script"); s.async = true; s.type = "text/javascript";s.src = "https://servedbyadbutler.com/app.js";var n = document.getElementsByTagName("script")[0]; n.parentNode.insertBefore(s, n);}());}
var AdButler = AdButler || {}; AdButler.ads = AdButler.ads || []; var abkw = window.abkw || ""; var plc366606 = window.plc366606 || 0; (function(){ var divs = document.querySelectorAll(".plc366606:not([id])"); var div = divs[divs.length-1]; div.id = "placement_366606_"+plc366606; AdButler.ads.push({handler: function(opt){ AdButler.register(172179, 366606, [728,90], "placement_366606_"+opt.place, opt); }, opt: { place: plc366606++, keywords: abkw, domain: "servedbyadbutler.com", click:"CLICK_MACRO_PLACEHOLDER" }}); })();

The analysis comes from crypto analyst CW, and according to this projection, this could be the first bullish wick that shows sellers are losing control on this higher timeframe.
 Source:
Chart from CW on X
Source:
Chart from CW on X
It is important to note that the rally hasn’t kicked off yet, and XRP is still looking to solidify a break above $1.4. Also, indicators are yet to print full-scale uptrend signals, but according to the analyst, these bullish reversal signals will appear soon.
Those sub-indicators are visually consistent with a momentum oscillator cycling between oversold and overbought extremes shown in the chart below. They have printed blue dots at every significant XRP low since 2014, including the floors that preceded the 2017 and 2021 rallies. A new blue dot appears to be forming now.
var rnd = window.rnd || Math.floor(Math.random()*10e6); var pid607472 = window.pid607472 || rnd; var plc607472 = window.plc607472 || 0; var abkw = window.abkw || ''; var absrc = 'https://servedbyadbutler.com/adserve/;ID=172179;size=0x0;setID=607472;type=js;sw='+screen.width+';sh='+screen.height+';spr='+window.devicePixelRatio+';kw='+abkw+';pid='+pid607472+';place='+(plc607472++)+';rnd='+rnd+';click=CLICK_MACRO_PLACEHOLDER'; document.write('
');
if (!window.AdButler){(function(){var s = document.createElement("script"); s.async = true; s.type = "text/javascript";s.src = "https://servedbyadbutler.com/app.js";var n = document.getElementsByTagName("script")[0]; n.parentNode.insertBefore(s, n);}());}
var AdButler = AdButler || {}; AdButler.ads = AdButler.ads || []; var abkw = window.abkw || ""; var plc452518 = window.plc452518 || 0; (function(){ var divs = document.querySelectorAll(".plc452518:not([id])"); var div = divs[divs.length-1]; div.id = "placement_452518_"+plc452518; AdButler.ads.push({handler: function(opt){ AdButler.register(172179, 452518, [728,90], "placement_452518_"+opt.place, opt); }, opt: { place: plc452518++, keywords: abkw, domain: "servedbyadbutler.com", click:"CLICK_MACRO_PLACEHOLDER" }}); })();
Multi-Phase Cycle That Sends XRP Price To $21.5
The chart attached to the analysis lays out two cycle structures divided into four separate phases. In the first cycle, Phase 1 was the initial markup, Phase 2 a massive correction, Phase 3 a prolonged descending consolidation inside a symmetrical triangle, and Phase 4 was a breakout.

XRP Starts New Week With Bullish Confirmation, But This Level Is A Problem
The technical analysis places the current cycle as tracing the same sequence almost precisely. Phase 2 printed as the post-2021 bear market decline, Phase 3 as the multi-year compression between 2022 and 2024, and the surge to $3.65 as the first part of Phase 4 in the new cycle.
XRP is now, by this reading, still playing out Phase 4 into a move that overshoots everything that came before, despite being down by about 62% from its all-time high price. Interestingly, the chart also labels the first upside objective as a return to this all-time high.
var rnd = window.rnd || Math.floor(Math.random()*10e6); var pid607473 = window.pid607473 || rnd; var plc607473 = window.plc607473 || 0; var abkw = window.abkw || ''; var absrc = 'https://servedbyadbutler.com/adserve/;ID=172179;size=0x0;setID=607473;type=js;sw='+screen.width+';sh='+screen.height+';spr='+window.devicePixelRatio+';kw='+abkw+';pid='+pid607473+';place='+(plc607473++)+';rnd='+rnd+';click=CLICK_MACRO_PLACEHOLDER'; document.write('
');
if (!window.AdButler){(function(){var s = document.createElement("script"); s.async = true; s.type = "text/javascript";s.src = 'https://servedbyadbutler.com/app.js';var n = document.getElementsByTagName("script")[0]; n.parentNode.insertBefore(s, n);}());}
var AdButler = AdButler || {}; AdButler.ads = AdButler.ads || []; var abkw = window.abkw || ''; var plc452519 = window.plc452519 || 0; (function(){ var divs = document.querySelectorAll(".plc452519:not([id])"); var div = divs[divs.length-1]; div.id = "placement_452519_"+plc452519; AdButler.ads.push({handler: function(opt){ AdButler.register(172179, 452519, [728,90], 'placement_452519_'+opt.place, opt); }, opt: { place: plc452519++, keywords: abkw, domain: 'servedbyadbutler.com', click:'CLICK_MACRO_PLACEHOLDER' }}); })();
Therefore, before any talk of double-digit prices, XRP would first need to reclaim the zone around its prior record of $3.65. CW’s final projection is a cycle top at $21.5, which he ties to the Fibonacci 6.618 extension level. That level is marked as TP2 on the chart, with the all-time high zone serving as TP1.
 XRP trading at $1.37 on the 1D chart | Source: XRPUSDT on
Tradingview.com
XRP trading at $1.37 on the 1D chart | Source: XRPUSDT on
Tradingview.com
0
0
Disclaimer: The content of this article solely reflects the author's opinion and does not represent the platform in any capacity. This article is not intended to serve as a reference for making investment decisions.
Understand the market, then trade.
Bitget offers one-stop trading for cryptocurrencies, stocks, and gold.
Trade now!
You may also like
FHA Loans Face Credit Tightening in 2026 as Delinquencies Rise
101 finance•2026/03/12 21:21
Calavo: Overview of Fiscal First Quarter Earnings
101 finance•2026/03/12 21:21
You should keep an eye on these undervalued financial stocks
101 finance•2026/03/12 21:19
Adobe Stock Faces AI Uncertainty: Earnings, Valuation, and Growth Outlook in 2026
101 finance•2026/03/12 21:19
Trending news
MoreCrypto prices
MoreBitcoin
BTC
$70,392.24
-0.23%
Ethereum
ETH
$2,066.85
+0.04%
Tether USDt
USDT
$1
-0.01%
BNB
BNB
$651.16
-0.28%
XRP
XRP
$1.37
-1.20%
USDC
USDC
$0.9999
-0.02%
Solana
SOL
$86.57
-0.93%
TRON
TRX
$0.2890
-0.73%
Dogecoin
DOGE
$0.09440
+0.66%
Hyperliquid
HYPE
$37.26
+2.62%
How to buy BTC
Bitget lists BTC – Buy or sell BTC quickly on Bitget!
Trade now
Become a trader now?A welcome pack worth 6200 USDT for new users!
Sign up now