
Pi Coin Price Caught Between Bulls and Bears — But One Side Has the Edge

Pi Coin price sits at $0.20, trapped between bullish hope and bearish pressure. A tiny 5% drop could trigger a selloff, while a 34% surge is needed for a breakout.
Pi Coin (PI) price is down 2% in the past 24 hours and 4.5% over the last week, extending its 43% monthly decline. The token has been stuck in a tight range near $0.20, with neither buyers nor sellers taking full control.
However, recent signals show a clear divide between bullish and bearish forces. While sellers appear to be losing some strength, key indicators still point to a fragile setup where the downside looks easier to trigger than a Pi Coin price recovery.
Two Bearish Indicators Keep Bulls on the Back Foot
The Money Flow Index (MFI), which tracks money moving in and out of the asset, highlights a bearish divergence. Between October 10 and 17, PI’s price formed a higher low, but the MFI printed a lower low. That pattern shows weaker buying strength despite stable prices — a sign that retail traders are holding back.
Want more token insights like this? Sign up for Editor Harsh Notariya’s Daily Crypto Newsletter .
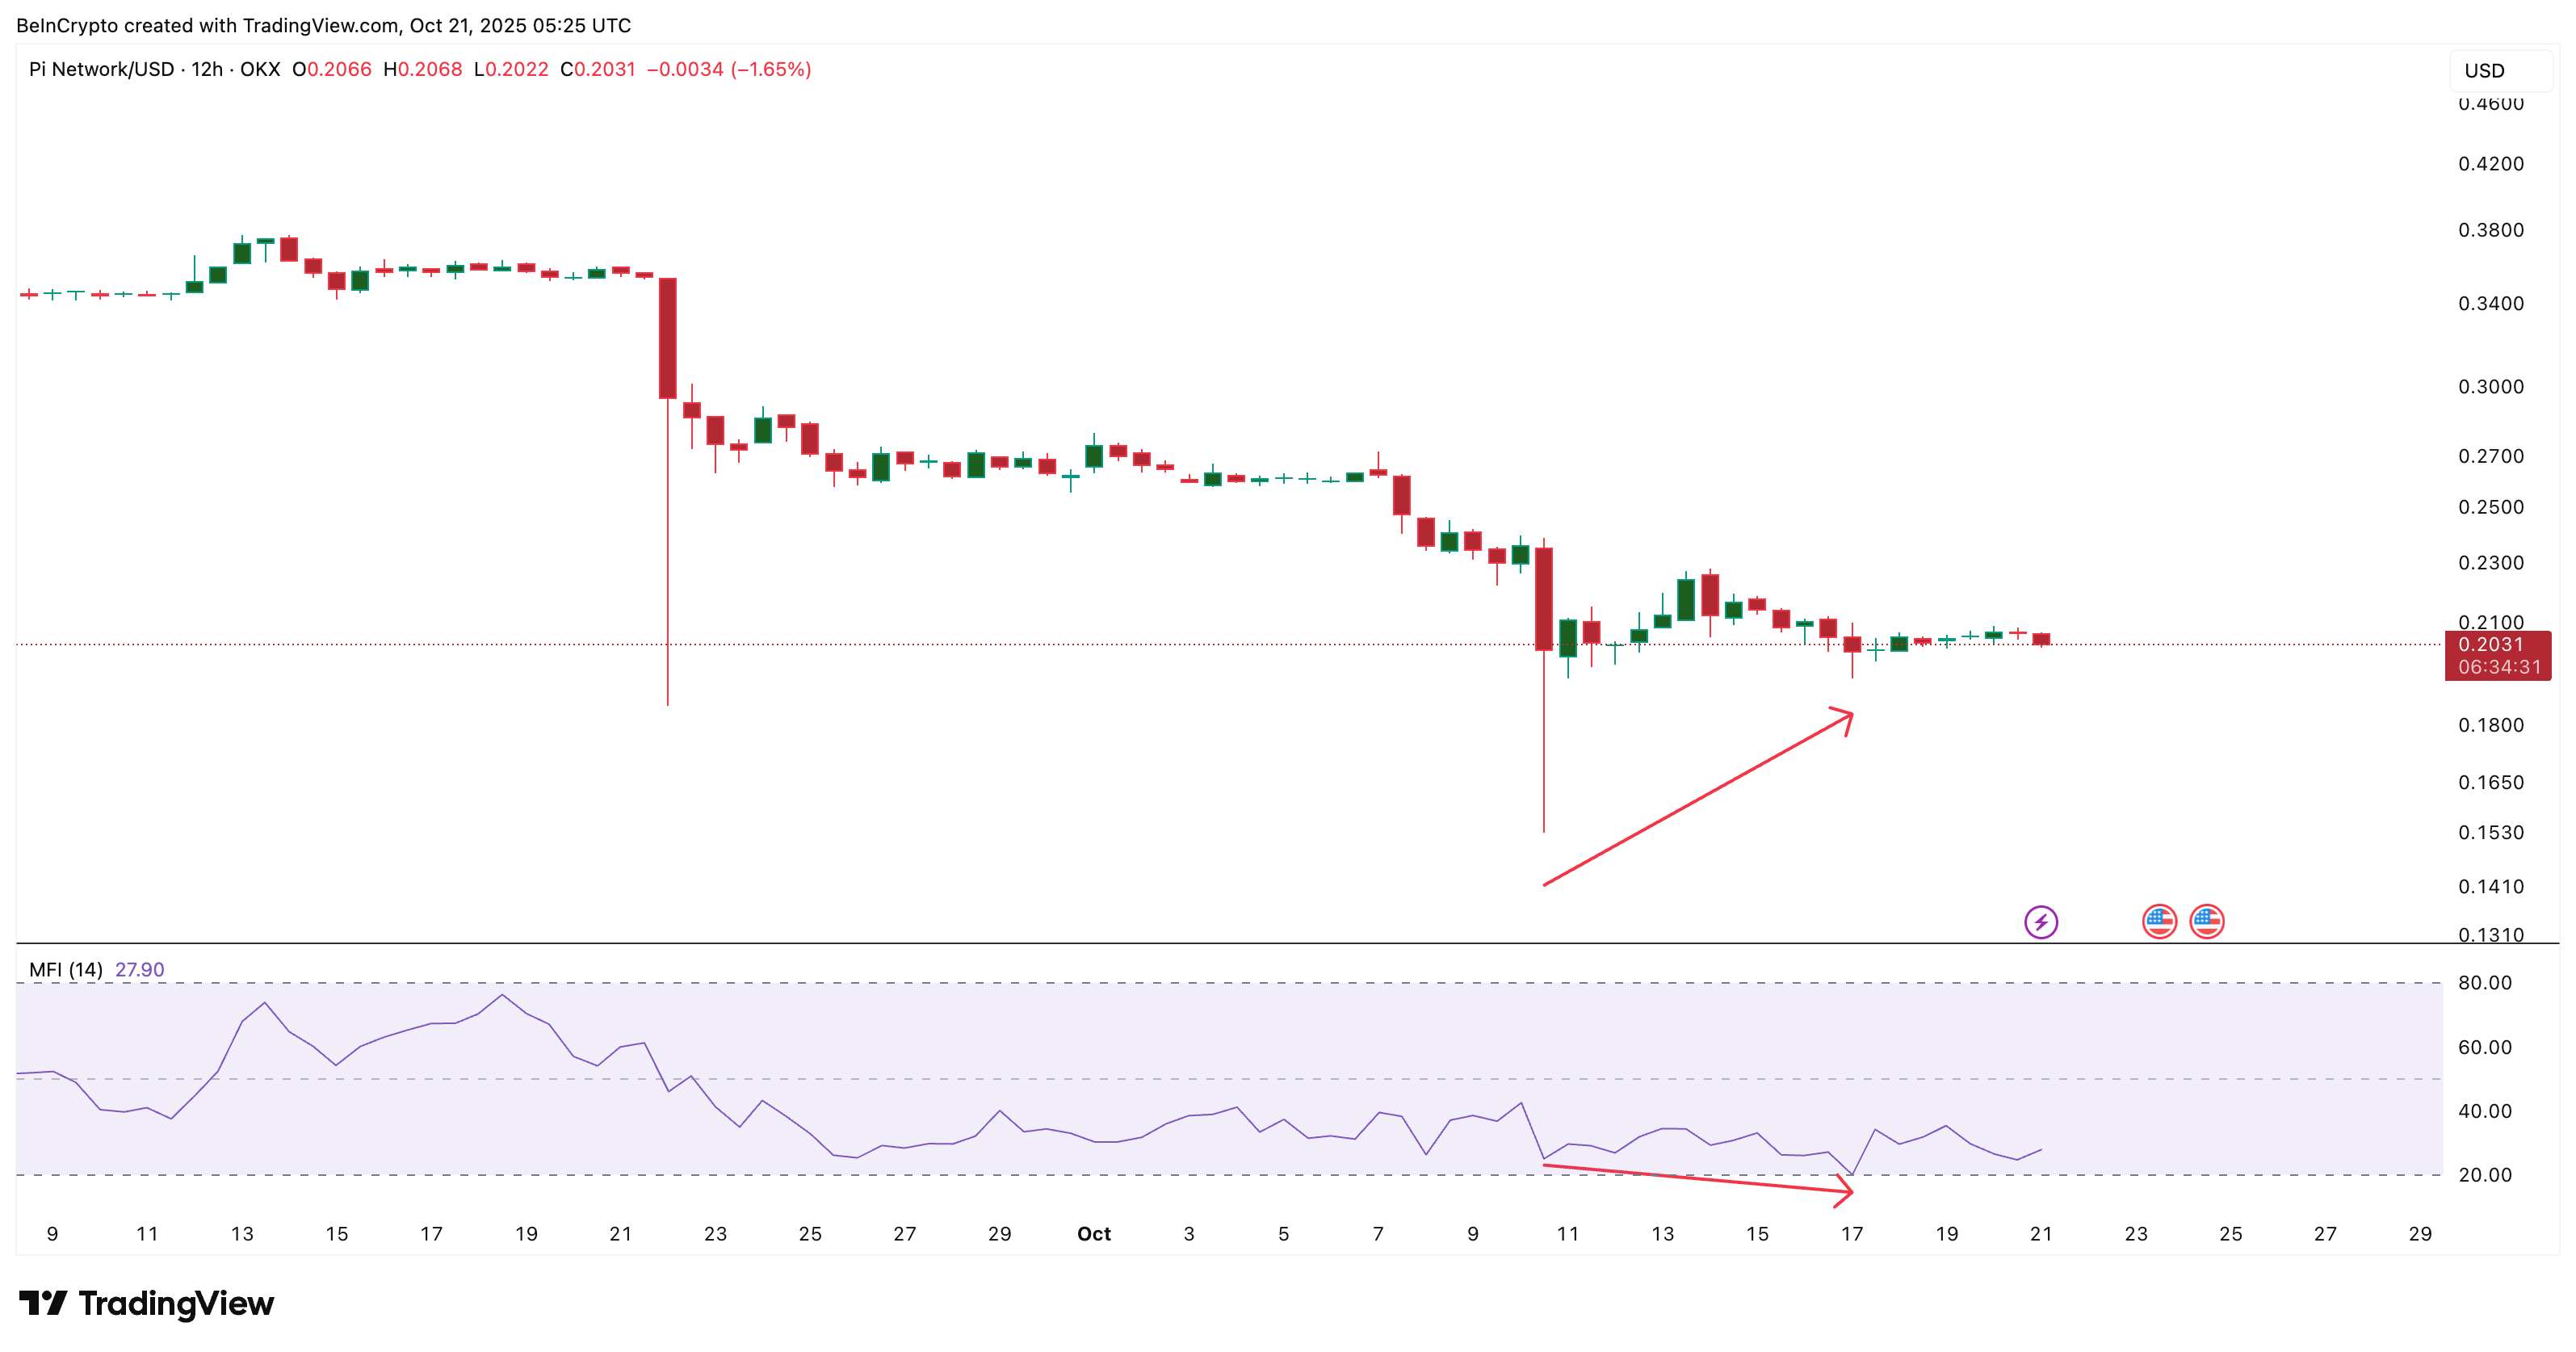 Pi Coin Retail Not Active Enough:
TradingView
Pi Coin Retail Not Active Enough:
TradingView
Adding to that, the Chaikin Money Flow (CMF), which tracks large money inflows, remains slightly positive but has fallen sharply since October 20. A drop in CMF above the zero line often signals that while big investors are still present, they’re pulling back on fresh buys.
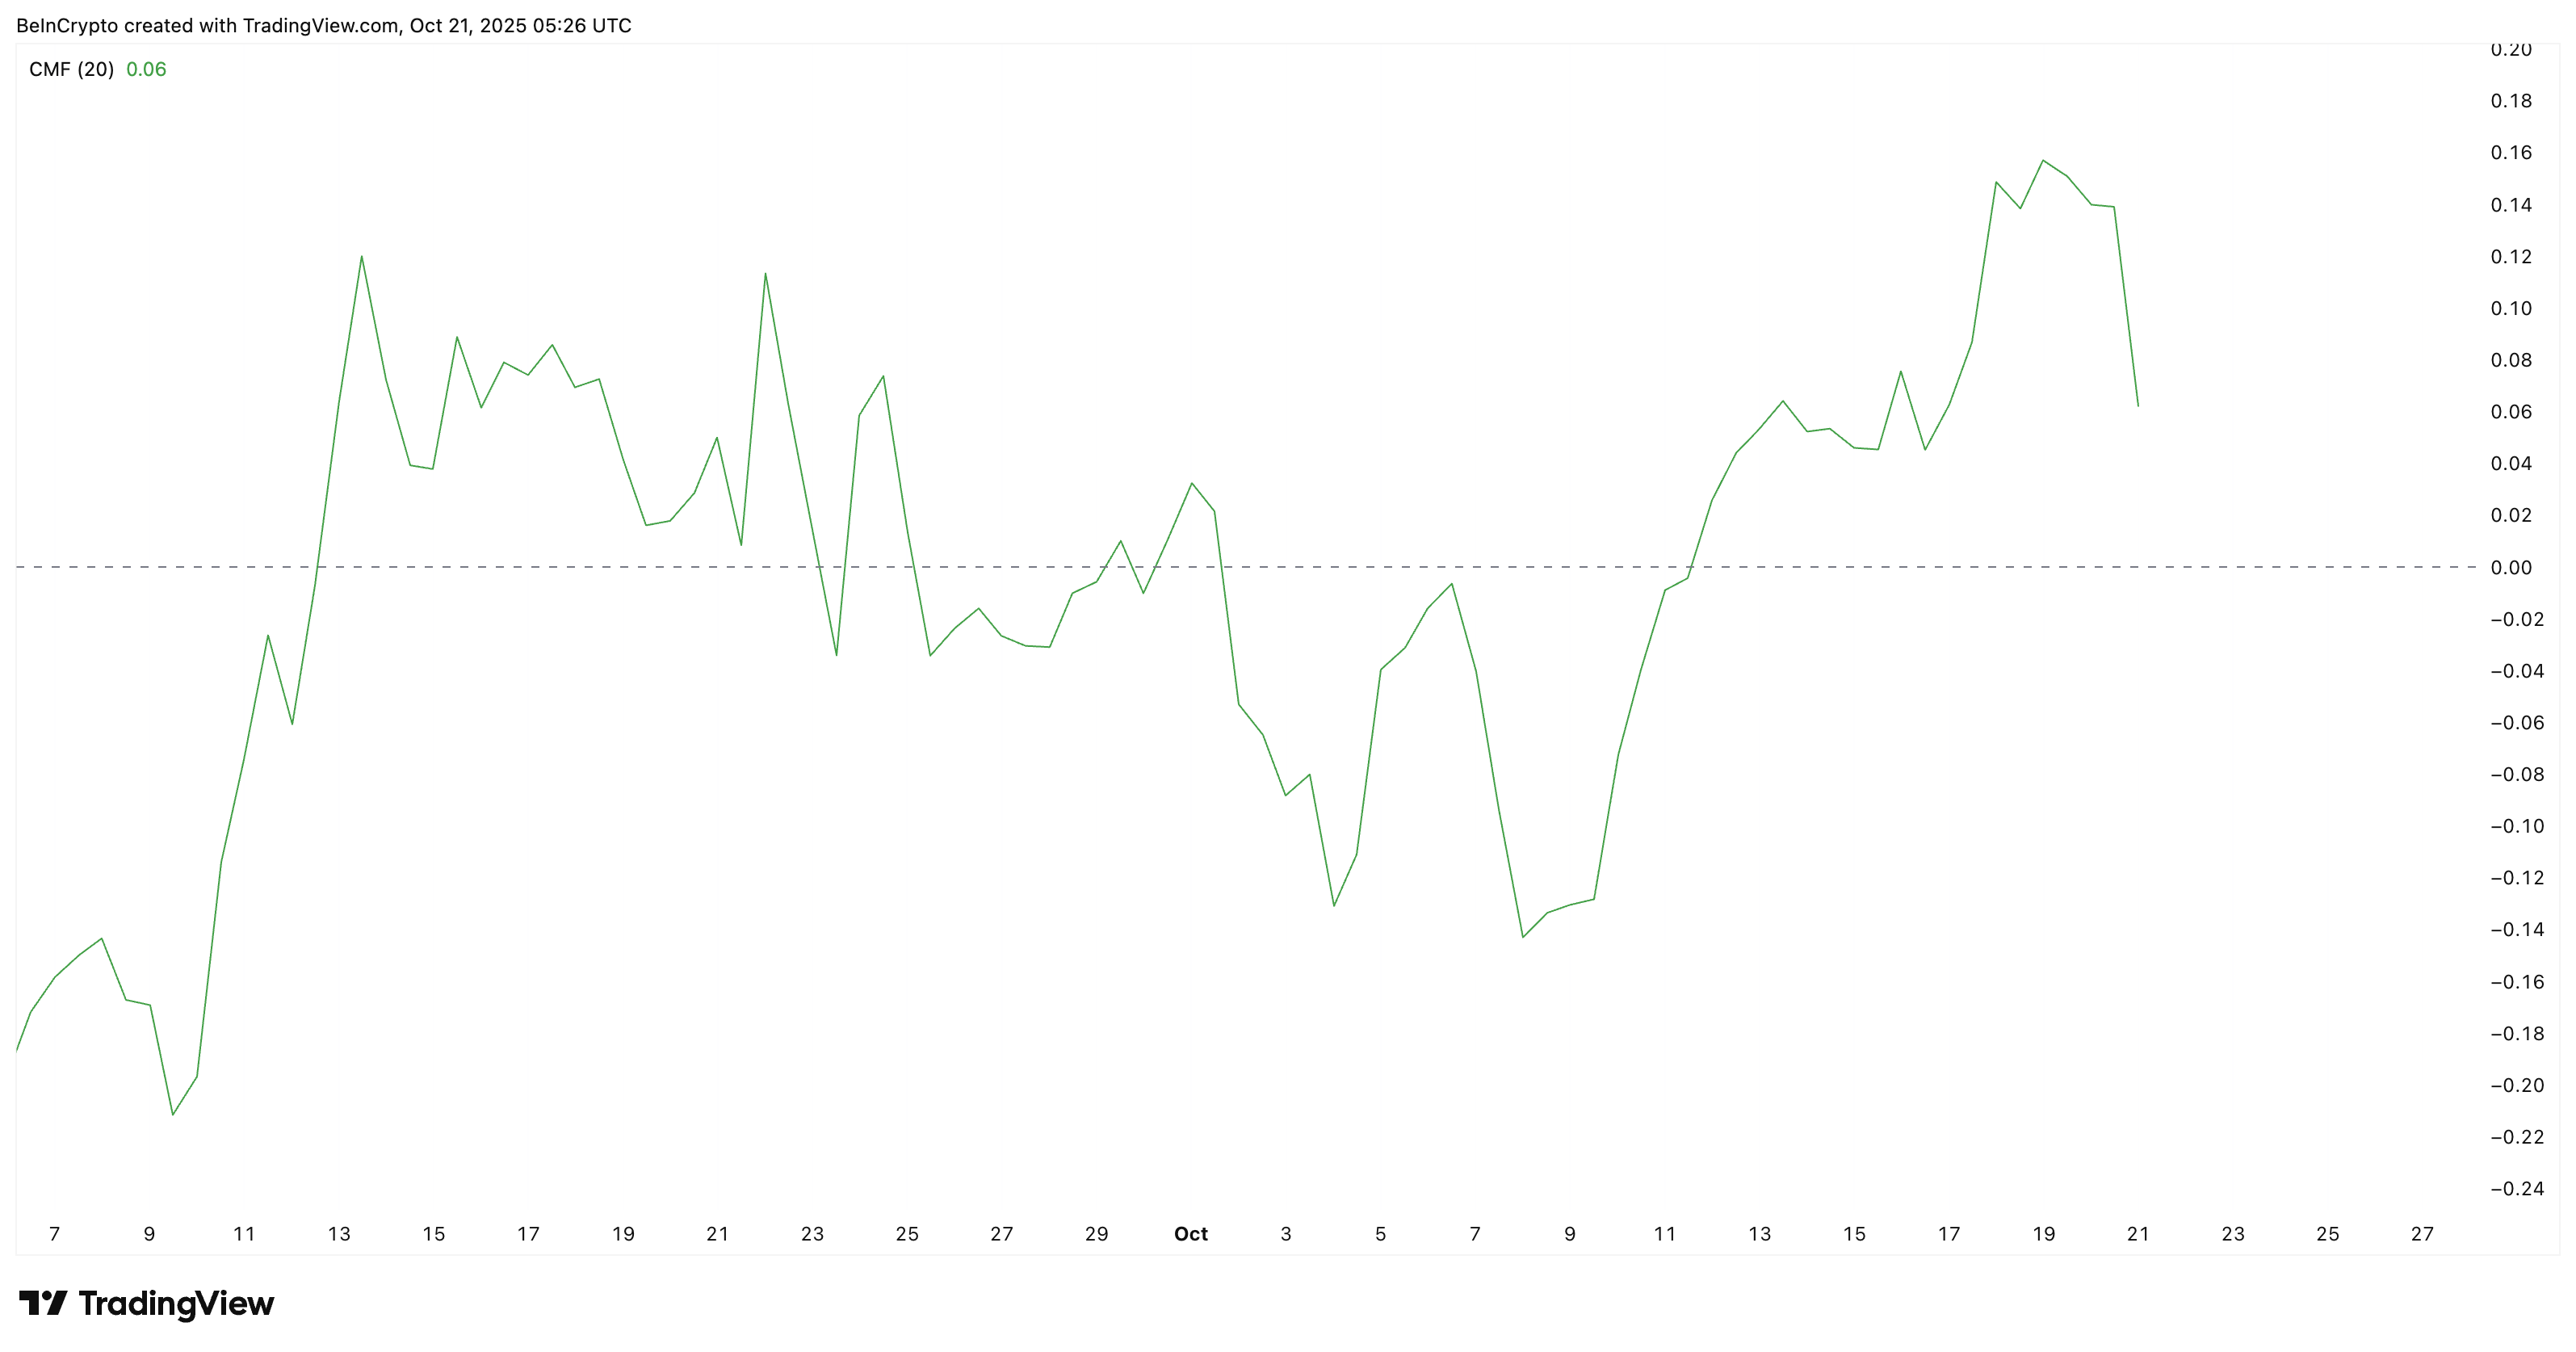 Large Money Leaving Pi Network:
TradingView
Large Money Leaving Pi Network:
TradingView
Together, the falling MFI and CMF point to fading demand from both small and large holders. Unless inflows improve, any Pi Coin price rebound could stay short-lived.
One Bullish Signal Keeps the Setup From Turning Fully Negative
The one indicator holding the bullish structure together is the Bull Bear Power (BBP). This indicator measures the gap between buying and selling strength. Since October 7, bearish momentum has been shrinking steadily. The red bars on the chart have grown smaller — showing that sellers are losing force.
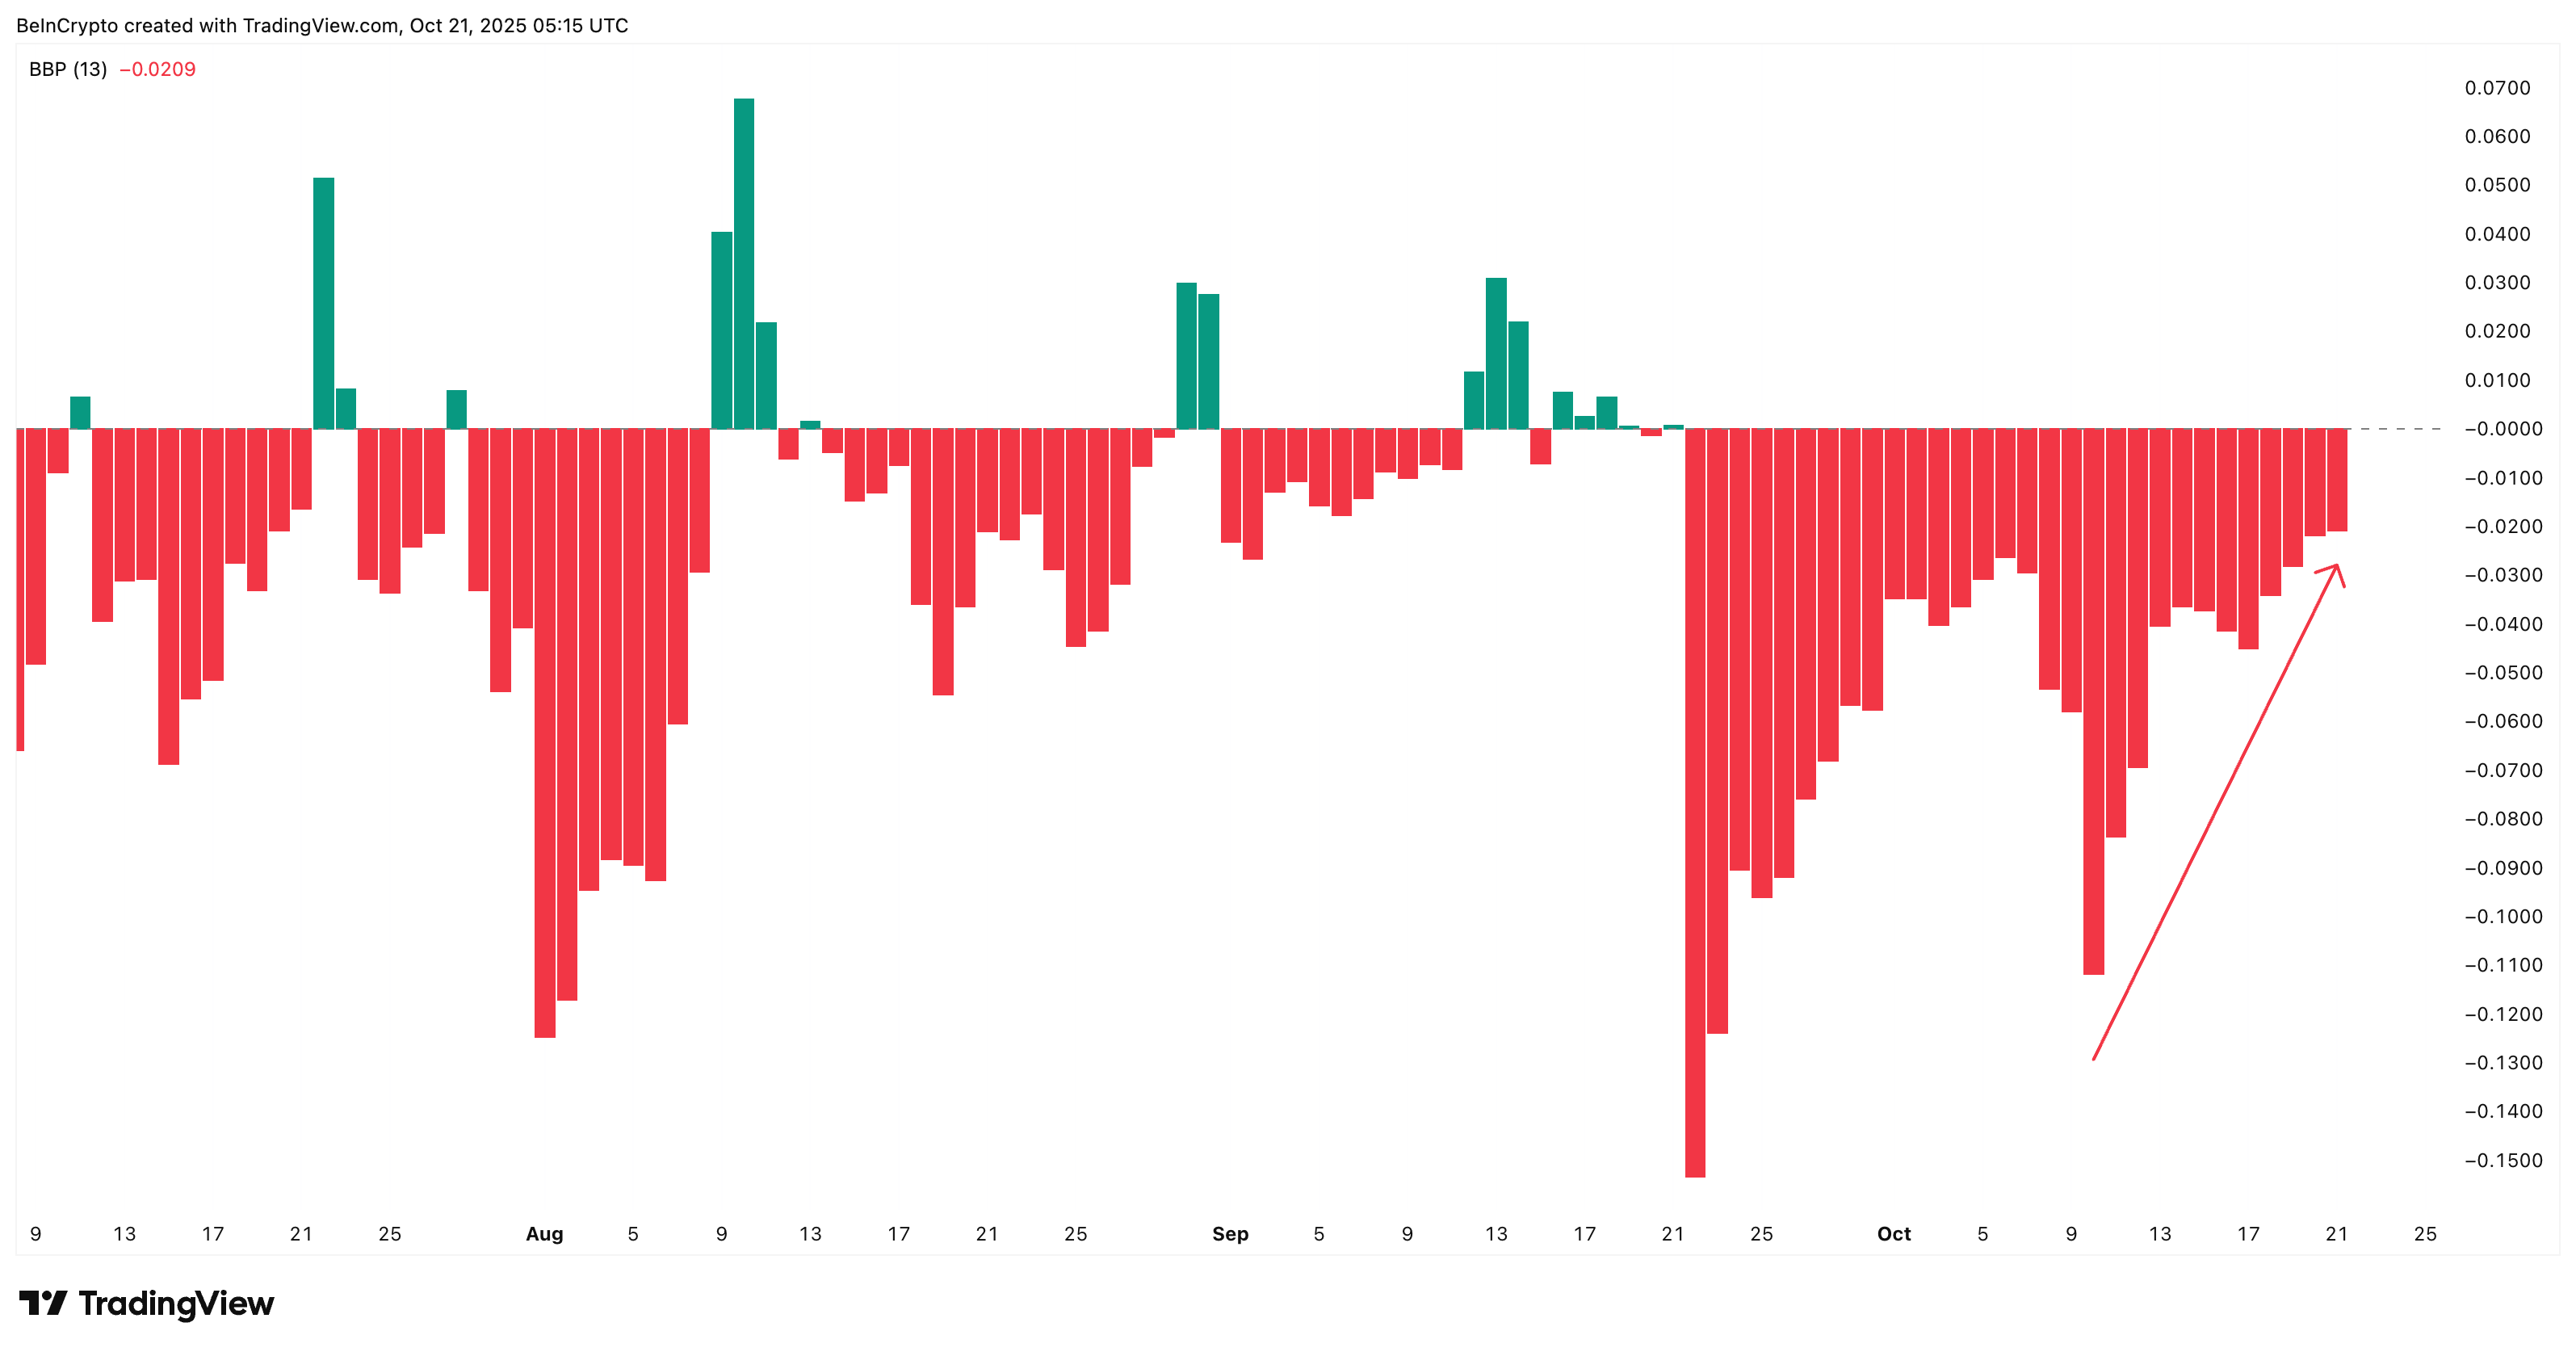 Pi Coin Bears Are Getting Weaker:
TradingView
Pi Coin Bears Are Getting Weaker:
TradingView
It’s not a full reversal yet, but the consistent decline in bearish power suggests that downside pressure is slowly wearing off. This is the only factor currently keeping Pi Coin’s short-term structure from breaking down completely.
Falling Pi Coin Price Wedge Pattern Hints at a Battle Between Two Extremes
Pi Coin continues to trade inside a falling wedge on the daily timeframe. This pattern typically precedes bullish reversals. But the breakout point remains far above current levels.
For a confirmed upside move, the PI price would need a 34% rally to cross $0.27 (the strongest near-term resistance), followed by a close above $0.29 to break the upper wedge boundary. If that happens, the price could target $0.30 and even $0.34.
On the other hand, the bearish scenario is much easier to trigger. A clean drop below $0.19 could send the Pi Coin price quickly to $0.15, where the wedge’s lower trendline sits. Since that lower wedge trendline only comes with two clear touchpoints, it’s weak — and a break there could open the door to deeper losses.
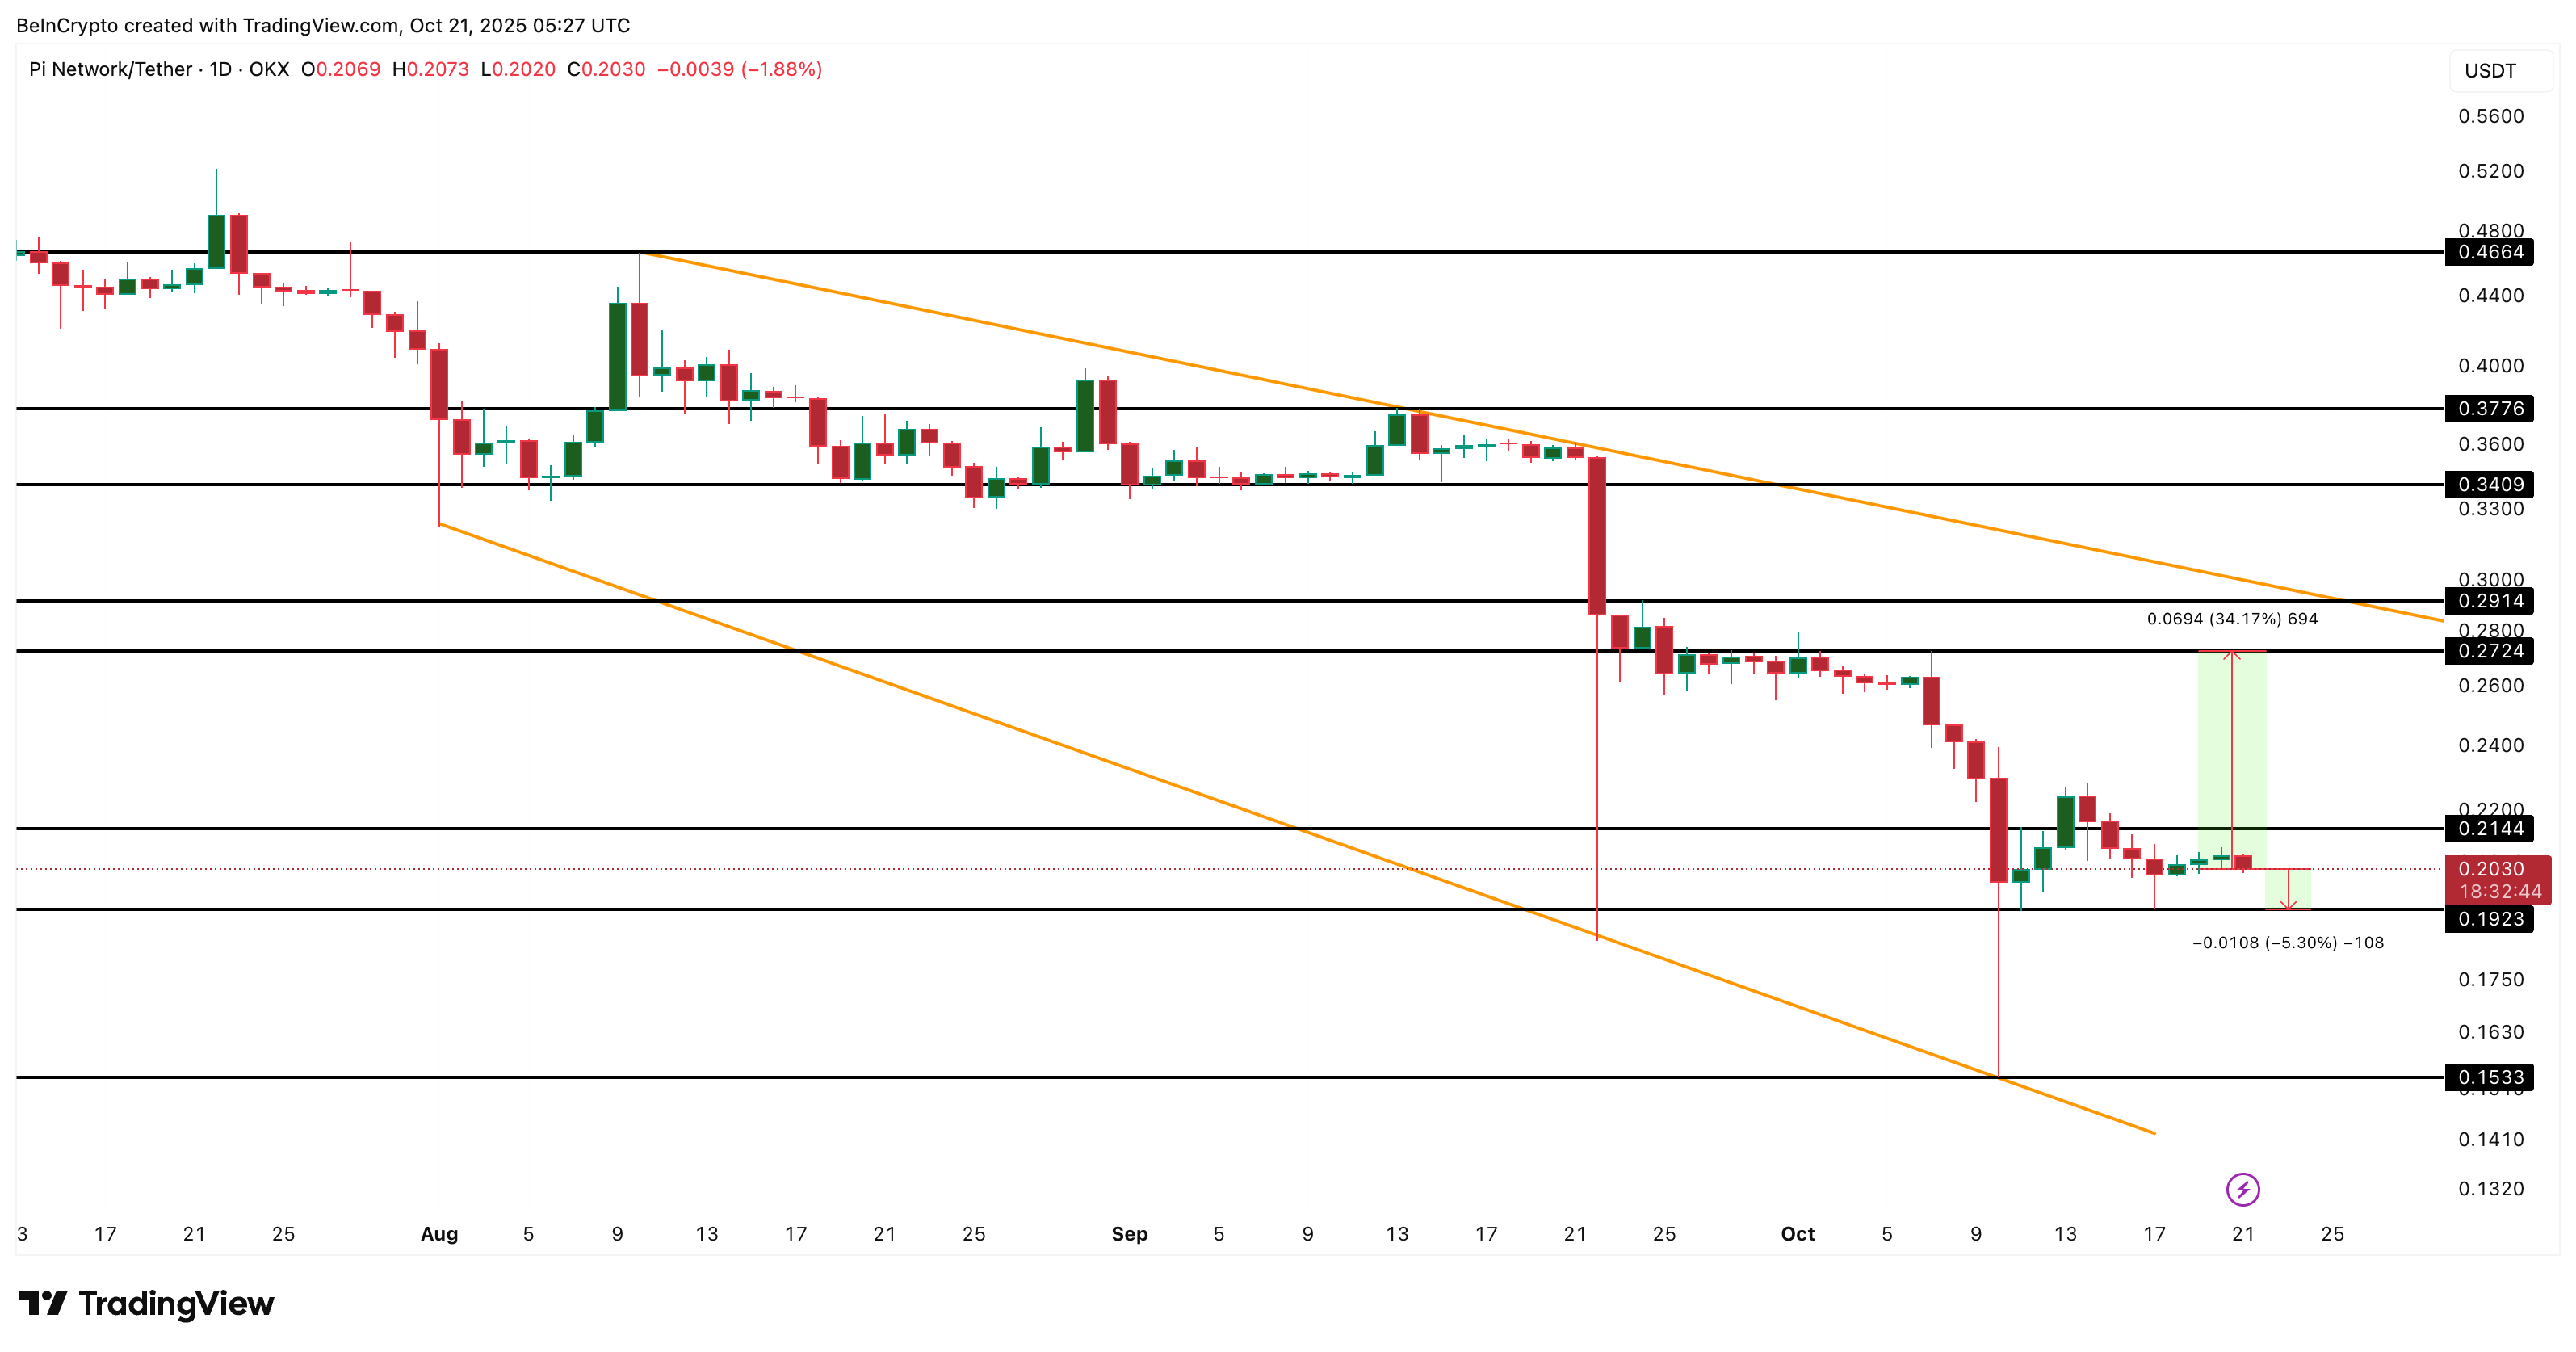 Pi Coin Price Analysis:
TradingView
Pi Coin Price Analysis:
TradingView
In short, the Pi Coin bears have a shorter distance to win. A 5% drop would confirm a breakdown, while bulls need more than six times that effort for a breakout.
Disclaimer: The content of this article solely reflects the author's opinion and does not represent the platform in any capacity. This article is not intended to serve as a reference for making investment decisions.
You may also like
Seasoned Traders Eye Bitcoin and Ethereum Signals as Crypto Downturn Deepens
Decent Holding Stock Surges After FY25 Sales Boost
Why tokenization could make Solana a CLARITY Act winner
The unexpected Iran conflict did not discourage the dovish members of Poland's central bank