US President Trump appears weary of USMCA negotiations, while diplomatic tensions with Iran continue to simmer. Even as US employment data surprised to the upside today, all eyes have already turned to Friday’s inflation report. Bitcoin’s initial rebound proved short-lived; after Wall Street’s opening bell, the world’s largest cryptocurrency quickly lost ground. Amid these crosswinds, crypto enthusiasts are left asking: are digital currencies truly oversold?
Are Cryptos Bottoming Out?
Bitcoin is currently hovering near $66,500 after dropping as low as $60,000 last week, in a sharp reversal that caught markets off guard. Few anticipated such steep losses in such a condensed timeframe. According to K33 Research, however, a glimmer of optimism is emerging. Company analysts suggest that several key metrics now reveal constructive signals for Bitcoin’s trajectory.
K33, a brokerage and research firm, points to last week’s intense sell-off as a possible marker for a local bottom in Bitcoin. Vetle Lunde, K33 Research’s Head of Research, described “extreme edge signals” manifesting across ETF, spot, and derivatives markets, indicating what he called “capitulation” conditions.
- Fund rates have fallen to levels reminiscent of the US banking crisis in March 2023.
- Option skewness has soared to stress points last seen during the depths of the 2022 bear market.
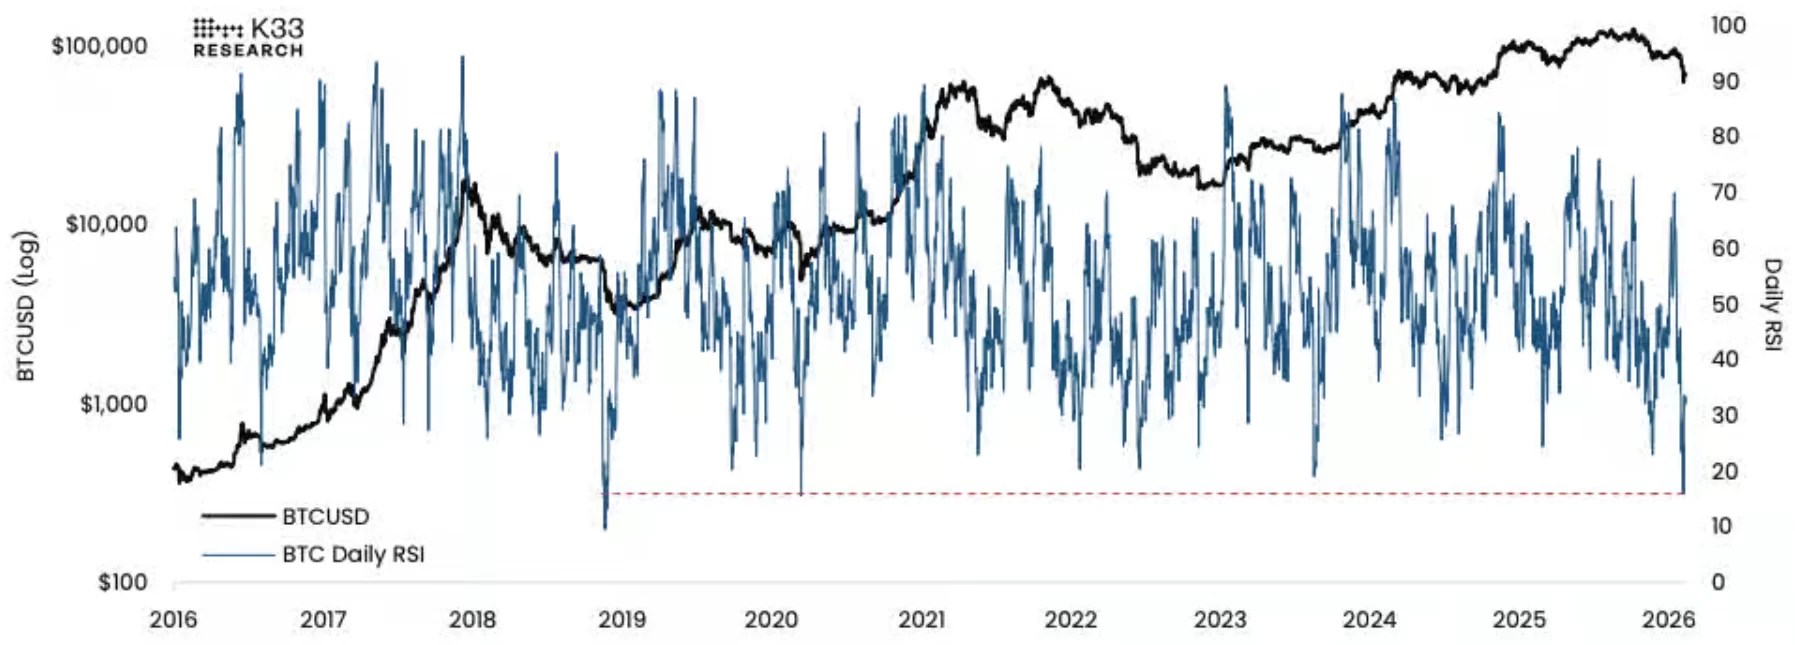
Such developments lend weight to calls that a trough could be in. Ongoing sell pressure since January 20 has driven Bitcoin’s daily RSI down to just 15.9—the sixth-deepest point since 2015. Only the shocks of March 2020 and November 2018 saw lower readings.
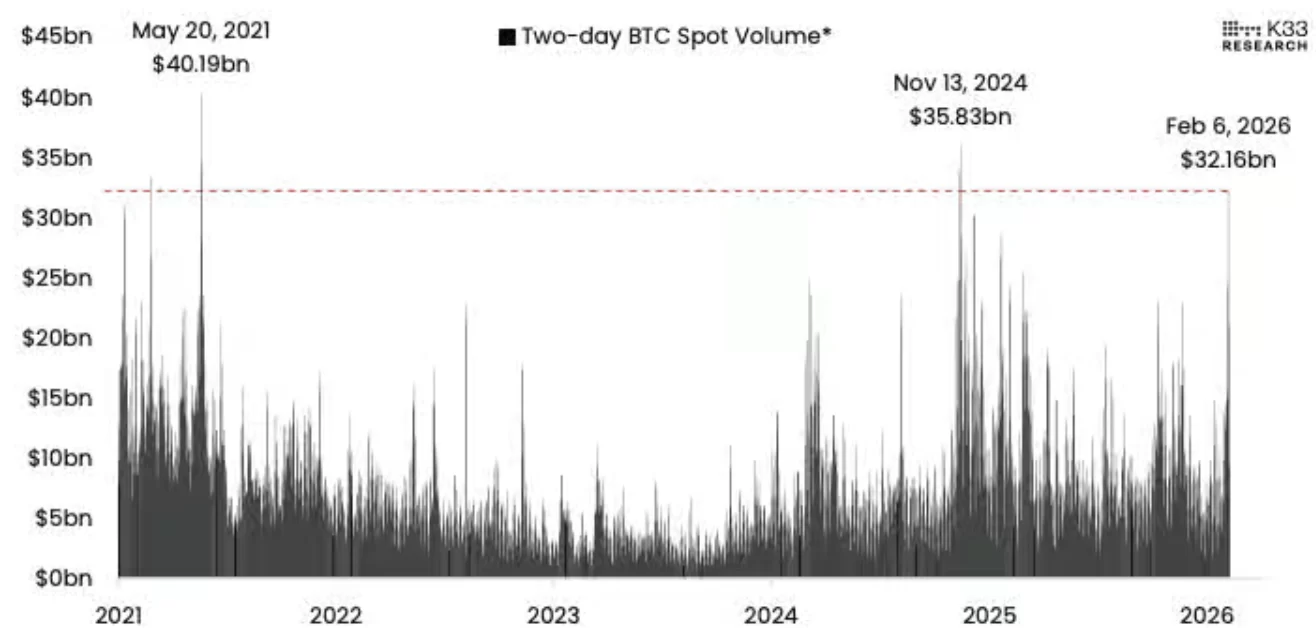
As the sell-off continued, the Crypto Fear & Greed Index plummeted to 6, highlighting an environment of extreme nervousness. Lunde observed that the price swings have been defined by “hyperactive trading.” Notably, Bitcoin’s spot trading volume soared to a record $32 billion over just two days on February 6.
Exceptional Metrics Mark the Bottom
K33’s Lunde argues that the current data points to an “exceptional period,” where a convergence of various indicators suggests a local bottom may be in place. One telling metric: funding rates for perpetual Bitcoin swaps plunged to -15.46% on February 6. The seven-day average slipped to -3.5%, a level not seen since September 2024.
Options market trends also signal intense risk aversion, a zone only breached previously during the FTX collapse. Meanwhile, the IBIT ETF hit historic highs on February 5, surpassing $10 billion in volume and clocking 284.4 million shares traded—a fresh record. That same day, IBIT experienced its fifth-largest net inflow since its launch.
Lunde maintains that records in volatility, volume, returns, option curves, and ETF flows reflect rare “exceptional figures,” all supporting the notion that a bottom is in place. According to K33 analysts, Bitcoin could remain range-bound between $60,000 and $75,000, with deeper lows unlikely in the near term.