4 GARP Stocks Investors Can Grab for Optimal Gains

Understanding GARP: A Balanced Approach to Investing
The Growth at a Reasonable Price (GARP) strategy is a popular method for investors seeking swift gains. By focusing on stocks that are undervalued according to fundamental analysis, GARP helps pinpoint opportunities where growth potential meets attractive pricing.
Investors using GARP gain access to companies with strong outlooks and discounted valuations. These stocks typically demonstrate robust performance in areas such as cash flow, revenue, and earnings per share (EPS), among other financial indicators.
A GARP-based portfolio is designed to combine the advantages of both value and growth investing. Notable examples of GARP stocks include Ralph Lauren, Brinker International, TechnipFMC, and ResMed.
Key GARP Criteria: Combining Growth and Value
The GARP method merges the best aspects of value and growth investing. Investors who follow this approach seek stocks trading below market value or below a target price determined by thorough analysis. These companies are selected for their promising financial metrics, including cash flow, revenue, and EPS.
Growth Factors
- GARP investors prioritize companies with consistent earnings growth and positive future prospects, but focus on moderate, sustainable growth rates—typically between 10% and 20%.
- Return on equity (ROE) is another important metric; GARP investors look for companies with ROE above the industry average.
- Positive cash flow is also a key consideration.
Value Factors
- The price-to-earnings (P/E) ratio is central to GARP investing. While GARP stocks may have higher P/E ratios than traditional value picks, extremely high P/E ratios are avoided.
- The price-to-book (P/B) ratio is also evaluated to ensure stocks are not overvalued.
Using these principles, a screening process can identify stocks with strong near-term return potential.
Screening Standards for GARP Stocks
In addition to the metrics above, the screening process includes:
- Zacks Rank #1 (Strong Buy) or #2 (Buy)
- EPS growth rates (last five years and projected 3-5 years) between 10% and 25% – Indicates solid historical and expected earnings growth.
- ROE (past 12 months) above the industry average – Suggests superior financial performance.
- P/E and P/B ratios below the industry average – Implies undervaluation relative to peers.
From this screening, four standout stocks emerged, each earning a Zacks Rank #1:
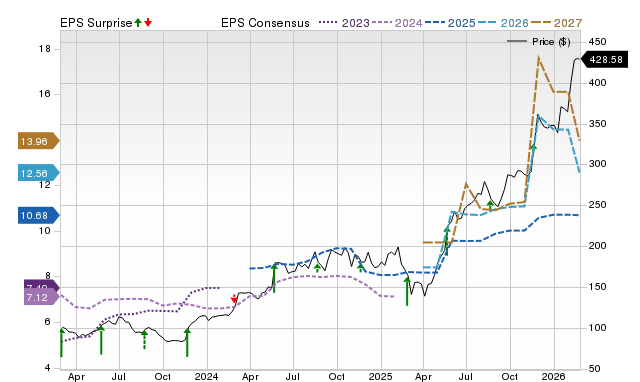
Ralph Lauren (RL)
Ralph Lauren has entered fiscal 2026 with strong momentum, driven by its "Next Great Chapter: Drive" strategy. In the third quarter, the company reported a 10% revenue increase (constant currency) to $2.4 billion, with notable growth in Asia (22%), North America (8%), and Europe (4%). Gross margins improved by 140 basis points to 69.8%, thanks to an 18% rise in average unit retail and reduced discounting.
The brand added 2.1 million new direct-to-consumer customers and raised its full-year revenue outlook to high-single or low-double-digit growth. The introduction of "Ask Ralph," an AI-powered shopping assistant, highlights its commitment to digital innovation and customer engagement.
RL shares have gained 27.6% over the past six months. The company has averaged a 9.73% earnings surprise in the last four quarters. The Zacks Consensus Estimate for fiscal 2026 earnings has increased by 5.4% to $16.26 per share in the past month.
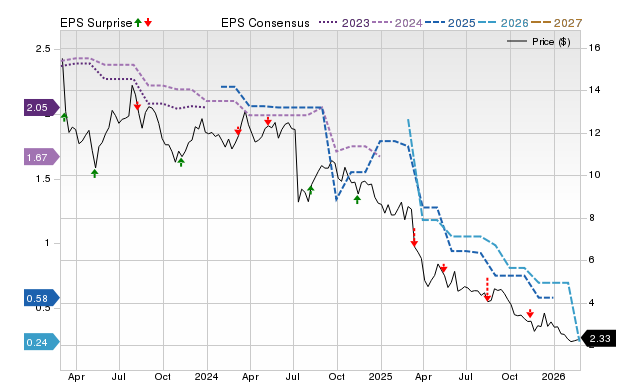
Brinker International (EAT)
Brinker International is showing sustained growth in fiscal 2026. After its January earnings report, the company raised its revenue guidance to $5.76–$5.83 billion, supported by Chili's 8.6% comparable sales growth in Q2 and a two-year stack of +43%. The company has achieved 19 consecutive quarters of same-store sales growth.
Brinker’s traffic gains reflect genuine customer acquisition, not just price increases. Menu innovation, such as a new chicken sandwich launching in April, enhances Chili's market position. Effective cost management and share buybacks further strengthen shareholder value.
Brinker shares have declined 12.8% over the past six months but have averaged an 8.21% earnings surprise in the last four quarters. The Zacks Consensus Estimate for fiscal 2026 earnings has risen by 2.9% to $10.66 per share in the past month.
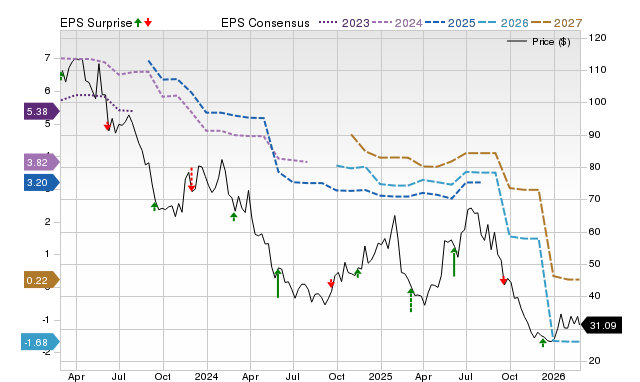
TechnipFMC (FTI)
TechnipFMC continues to benefit from strong fundamentals. In Q4 2025, the company reported $10.1 billion in Subsea inbound orders, a record backlog of $16.6 billion, and total inbound orders of $11.2 billion. Management raised 2026 Subsea revenue guidance to $9.2–$9.6 billion and improved EBITDA margin guidance to 21–22%.
The company declared a quarterly dividend in February, reflecting confidence in its capital allocation. In 2025, TechnipFMC returned $1 billion to shareholders through buybacks and dividends. With a growing backlog and expanding margins, the company is positioned for continued earnings growth in 2026.
FTI shares have soared 80.4% in the past six months. The company has averaged a 15.9% earnings surprise in the last four quarters. The Zacks Consensus Estimate for 2026 earnings has increased by 1.5% to $2.78 per share in the past month.
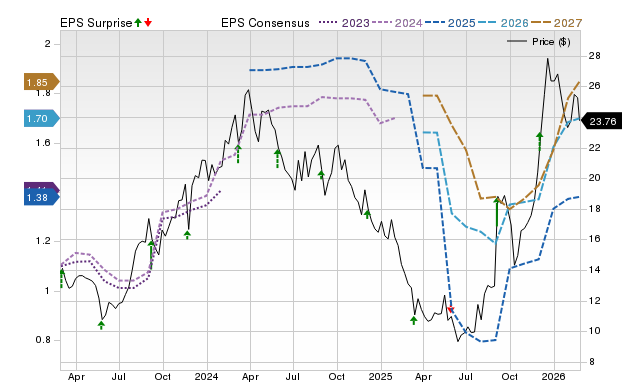
ResMed (RMD)
ResMed’s outlook for 2026 is supported by strong operational performance and product innovation. In the fiscal second quarter, revenues rose 11% to $1.4 billion, gross margin expanded to 61.8%, and operating income jumped 18%. The launch of Smart Comfort, an FDA-cleared AI-enabled CPAP device, aims to improve therapy adherence and expand the addressable market.
The AirTouch F30i Comfort mask, launched in February 2026, further enhances ResMed’s portfolio. These innovations strengthen the company’s connected-care ecosystem across more than 140 countries, reinforcing its leadership in digital sleep and respiratory health.
RMD shares have fallen 11.8% in the past six months. The company has averaged a 2.74% earnings surprise in the last four quarters. The Zacks Consensus Estimate for fiscal 2026 earnings has increased by 1% to $10.97 per share in the past month.
Explore Zacks' Top Stock Picks
Since 2000, Zacks' leading stock selection strategies have consistently outperformed the S&P's annual average gain of 7.7%. Remarkably, these strategies have achieved average yearly gains of:
- +48.4%
- +50.2%
- +56.7%
Access their current recommendations at no cost or obligation.
Disclaimer: The content of this article solely reflects the author's opinion and does not represent the platform in any capacity. This article is not intended to serve as a reference for making investment decisions.
You may also like
Analysts Predict Advanced Flower Capital Inc. (AFCG) Will See Lower Profits: Key Points to Watch
Earnings Outlook: Cracker Barrel Old Country Store (CBRL) Anticipates Lower Q2 Results
American Eagle Outfitters (AEO) Earnings Forecasted to Increase: Key Information Before Next Week’s Announcement
Dycom Industries (DY) Projected to Report Higher Earnings: Key Details Before Next Week’s Announcement