Middleby (NASDAQ:MIDD) Announces Q4 CY2025 Earnings With Revenue Falling Short of Analyst Projections

Middleby Q4 CY2025 Earnings Overview
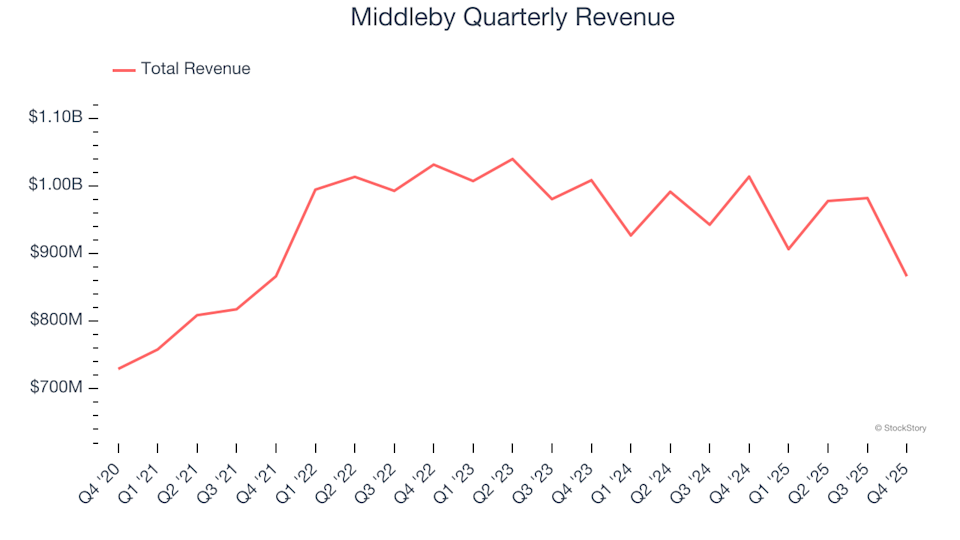
Middleby (NYSE:MIDD), a leading kitchen equipment manufacturer, reported fourth-quarter revenue for calendar year 2025 that fell short of market expectations. The company posted $866.4 million in sales, representing a 14.5% decrease compared to the same period last year. Looking ahead, Middleby’s guidance for next quarter’s revenue is $774 million, which is 14% below what analysts had anticipated. However, adjusted earnings per share came in at $2.42, surpassing consensus estimates by 7.2%.
Should You Consider Investing in Middleby?
Is this a good moment to buy Middleby shares?
Highlights from Middleby’s Q4 CY2025 Results
- Revenue: $866.4 million, missing analyst expectations of $977.5 million (down 14.5% year-over-year, 11.4% below estimates)
- Adjusted EPS: $2.42, exceeding the $2.26 forecast (7.2% above estimates)
- Adjusted EBITDA: $219.2 million, ahead of the $204.9 million estimate (25.3% margin, 7% beat)
- Q1 CY2026 Revenue Guidance: $774 million (midpoint), well below the $899.8 million analyst consensus
- FY2026 Adjusted EPS Guidance: $9.28 (midpoint), 1.9% under analyst projections
- FY2026 EBITDA Guidance: $762.5 million (midpoint), trailing the $820.2 million estimate
- Operating Margin: 17.3%, unchanged from the prior year’s quarter
- Free Cash Flow Margin: 19.1%, down from 22.3% a year ago
- Organic Revenue: Flat year-over-year (missed expectations)
- Market Cap: $7.95 billion
About Middleby
Middleby (NYSE:MIDD) is a prominent manufacturer in the food service and equipment sector, known for holding a Guinness World Record for the fastest conveyor pizza oven ever built.
Trends in Revenue Growth
Evaluating a company’s long-term growth can reveal much about its underlying strength. While any business might have a strong quarter or two, truly outstanding companies demonstrate consistent expansion over time. Over the past five years, Middleby’s revenue has grown at a compound annual rate of 8.2%, slightly outpacing the average for industrial companies and indicating solid demand for its products.
However, it’s important to look beyond five-year averages, as industry cycles and one-off events can impact results. In the last two years, Middleby’s revenue has declined at an annualized rate of 3.8%, marking a notable shift from its previous growth trajectory.
Understanding Organic Revenue
To get a clearer picture of Middleby’s core business, it’s useful to examine organic revenue, which excludes the effects of acquisitions and currency changes. Over the past two years, organic revenue has fallen by an average of 2.4% per year, closely mirroring the company’s overall revenue trend. This suggests that the main business, rather than external factors, has driven recent results.
Recent Performance and Outlook
This quarter, Middleby’s revenue dropped 14.5% year-over-year to $866.4 million, missing Wall Street’s forecasts. Management expects sales to decline by another 14.6% in the next quarter. Looking further ahead, analysts predict a 3.8% increase in revenue over the next year, which, while positive, is still below the industry average.
Profitability: Operating Margin
Operating margin is a key indicator of a company’s profitability, reflecting earnings before taxes and interest. Over the past five years, Middleby has maintained a strong average operating margin of 13%, placing it among the more profitable companies in its sector. This is supported by its robust gross margins.
Despite this, Middleby’s operating margin has decreased by 22.3 percentage points over the last five years, raising questions about its cost management, especially since revenue growth should typically enhance profitability through economies of scale.
In the latest quarter, the company’s operating margin was 17.3%, matching the figure from the same period last year, indicating recent stability in its cost structure.
Earnings Per Share (EPS) Analysis
Tracking EPS over time helps assess whether a company’s growth is translating into higher profitability for shareholders. Middleby’s EPS has increased at a compound annual rate of 13.2% over the past five years, outpacing its revenue growth and signaling improved profitability per share.
Much of this EPS growth is due to share buybacks, with the company reducing its share count by 9.2% over five years. This financial strategy has boosted EPS, even as operational efficiency played a lesser role.
However, in the past two years, EPS has declined at an annualized rate of 2.3%, reversing the earlier positive trend. In Q4, adjusted EPS was $2.42, down from $2.88 a year ago, but still 7.2% above analyst expectations. Wall Street anticipates full-year EPS to rise 3.4% to $9.22 over the next 12 months.
Summary of Middleby’s Q4 Performance
Middleby exceeded expectations for EBITDA and EPS this quarter, but its revenue and EBITDA guidance for the full year fell short of analyst forecasts. Overall, the quarter was relatively soft, with the stock price holding steady at $157.50 immediately after the results were announced.
While this wasn’t Middleby’s strongest quarter, investors considering the stock should weigh the broader context, including valuation, business fundamentals, and the latest earnings.
Disclaimer: The content of this article solely reflects the author's opinion and does not represent the platform in any capacity. This article is not intended to serve as a reference for making investment decisions.
You may also like
Warsh plans meeting with Tillis while Senate confirmation stays stalled
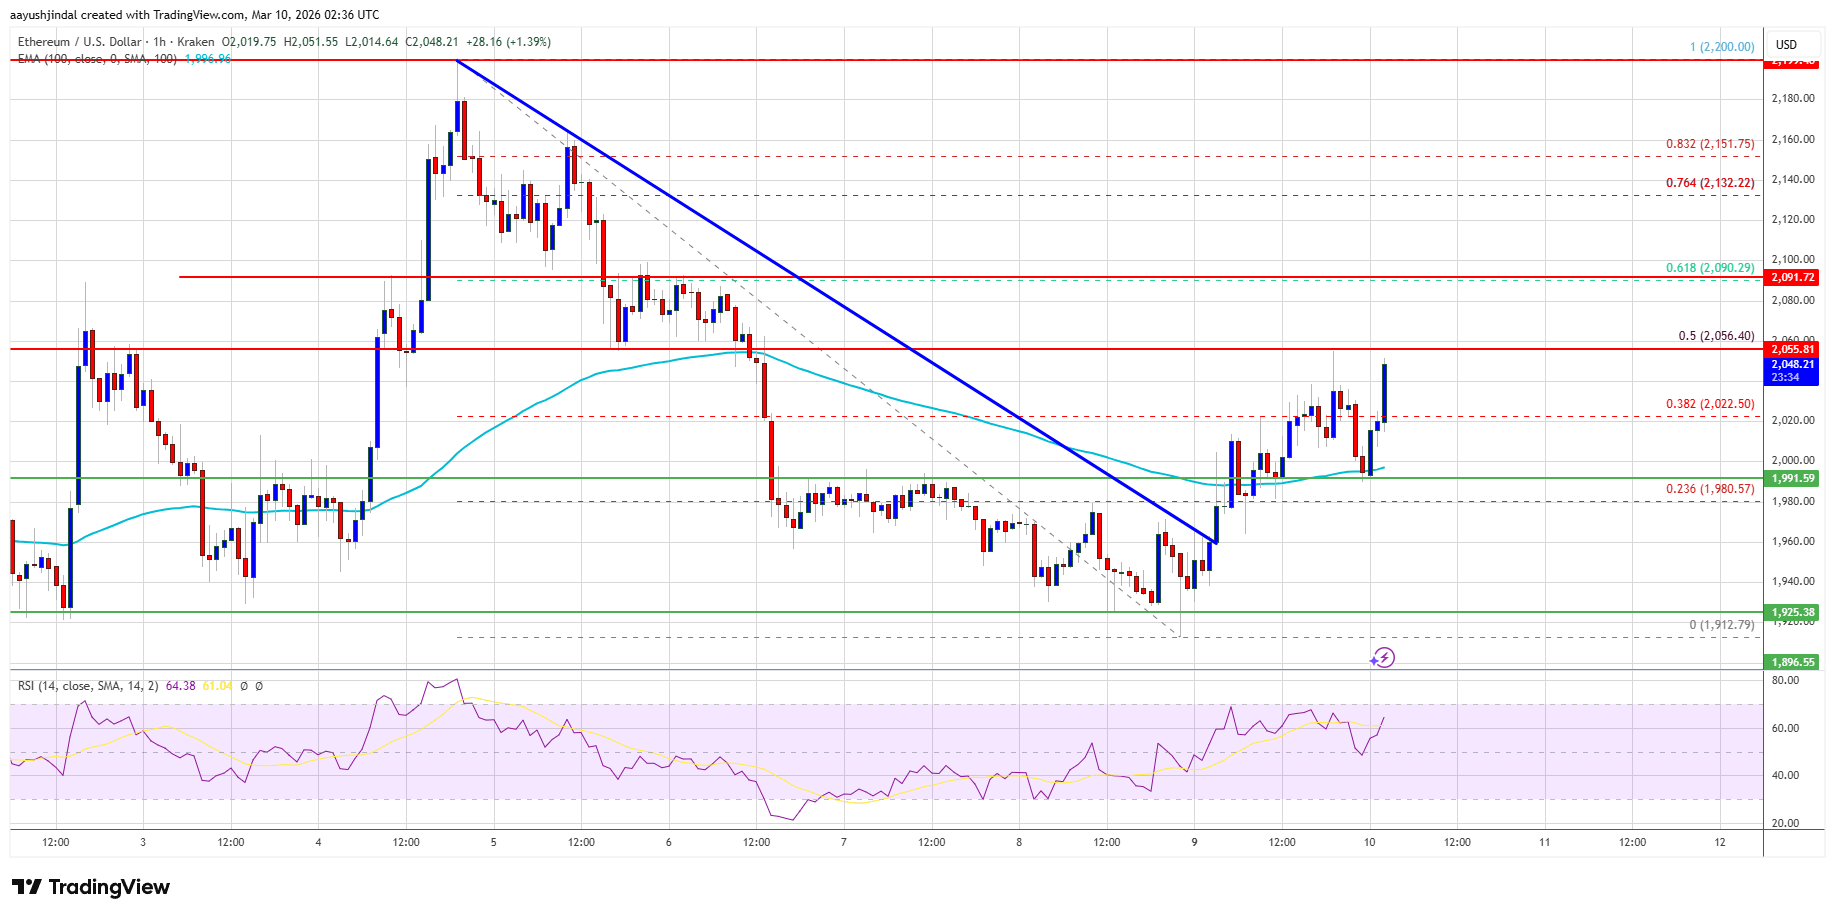
Ethereum Price Climbs Past $2,000, $2,200 Now in Bullish Crosshairs
ANIX Reports Smaller Losses but Revenue Remains at Zero
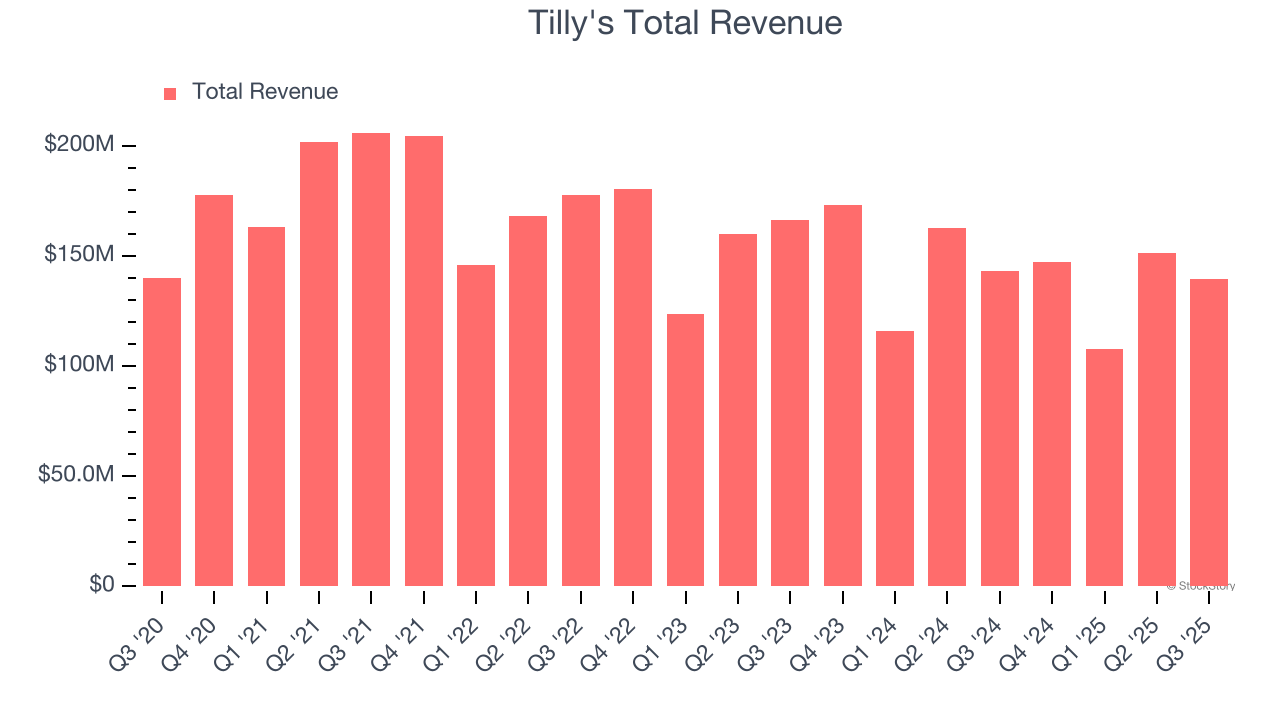
Tilly's (TLYS) To Report Earnings Tomorrow: Here Is What To Expect