
Middle East tensions rise, but US Treasuries and the US dollar have their own agendas? Gold faces a "sandwich" market after a sharp plunge—will there be a breakthrough tonight?

FXStreet March 5 News—— On Thursday (March 5), the global financial markets exhibited a highly sensitive volatility pattern against the backdrop of escalating tensions in the Middle East and a rebound in energy prices. The following analysis will start with U.S. Treasury yields, exploring their transmission mechanism to the dollar, focusing on how bond market volatility triggers gold’s safe-haven effect, and combining technical indicators and fundamental factors to forecast the trend for the next 2–3 days.
On Thursday (March 5), the global financial markets exhibited a highly sensitive volatility pattern amid the escalation of the Middle East situation and a rebound in energy prices. The 10-year U.S. Treasury yield remained around 4.120%, continuing the recent V-shaped reversal trend; the dollar index hovered around 98.9877, with clear signs of high-level oscillation; spot gold saw a modest rebound at 5165.95 USD/oz, attempting to find balance in the recovery phase after the previous day’s plunge. The short-term performance of these instruments is greatly influenced by the transmission of geopolitical risks to the bond market, with the adjustment of Federal Reserve policy expectations further reinforcing a cautious overall market risk appetite. Energy prices hit a new high of 76.61 USD, further amplifying inflation concerns and driving upwards pressure on bond yields. This in turn reinforces the dollar’s appeal as a safe-haven asset, while oppressing gold through opportunity costs. The following analysis starts from U.S. Treasury yields, explores their transmission mechanism to the dollar, and focuses on how bond market volatility triggers gold’s safe-haven effect, combining technical indicators and fundamentals to forecast the 2–3 day outlook.
Dynamics of U.S. Treasury Yields and the Dollar Transmission Mechanism
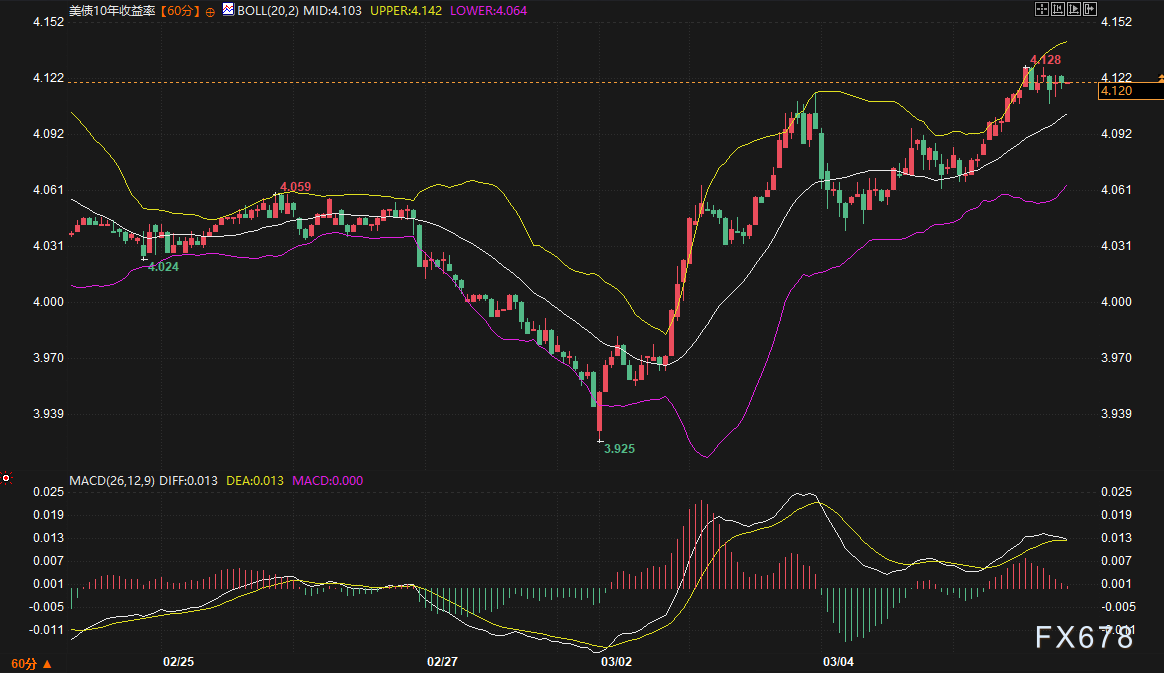
After significant recent fluctuations, the 10-year U.S. Treasury yield is currently quoted at 4.120%, close to the 4.128% local high. Between February 27 and March 2, the yield fell rapidly from 4.059% to a low of 3.925%, then launched a V-shaped reversal, strongly breaking through the earlier consolidation platform high. This reversal reflects the rapid cooling of market expectations for Fed rate cuts: the initial decline was driven by concerns about economic slowdown, but as energy prices rebounded and Middle East tensions escalated, inflation expectations rose, selling pressure on U.S. bonds intensified, and yields moved higher. Fundamentally, energy prices rebounded from last week’s high of 79.46 USD to a new high of 78.09 USD, directly magnifying bond market volatility. Overnight, U.S. Treasuries weakened further with increasing trading volume, indicating the market, while awaiting new developments in the Middle East, is growing more sensitive to possible inflation resurgence.
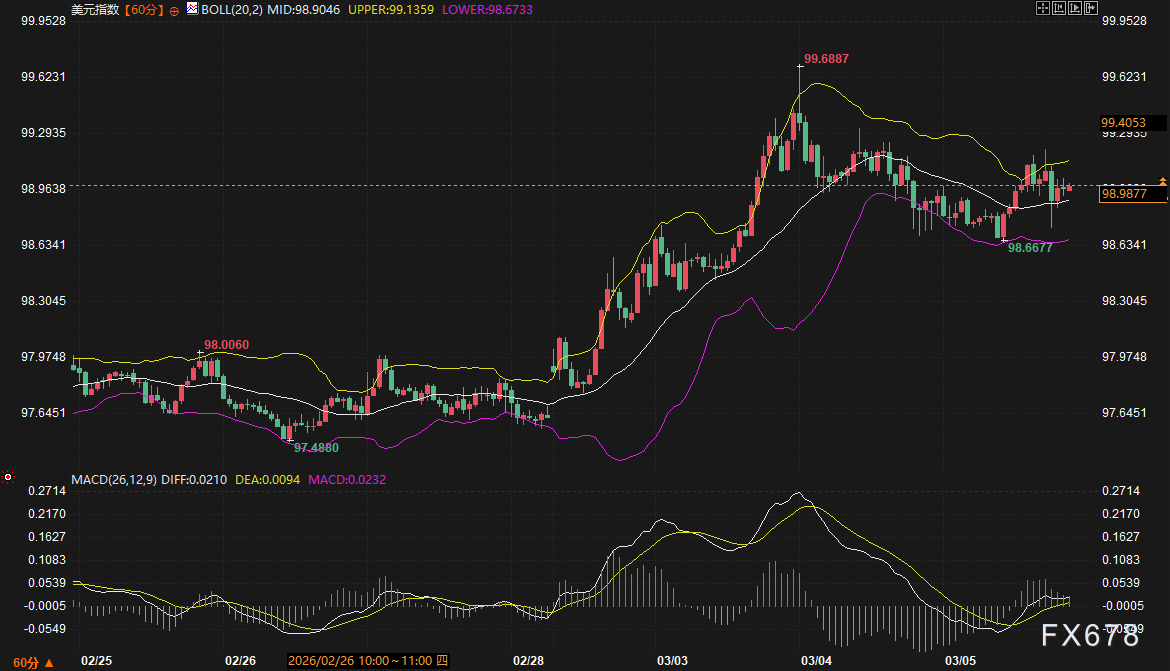
Technical indicators further confirm this strong setup. Bollinger Bands show prices running close to the upper band, with the middle band at 4.103% forming short-term support, and an expanding opening that suggests a bullish trend is firmly established. However, the MACD shows both DIFF and DEA at the 0.013 level, with the red bar close to zero and the fast and slow lines converging, hinting at possible exhaustion of short-term upside momentum. This means that if yields cannot effectively break above 4.13%, they may face a risk of stagnation. From the perspective of the transmission from the bond market to the dollar, higher U.S. Treasury yields directly increase the relative appeal of dollar assets: higher real yields increase the opportunity cost of holding non-interest-bearing assets, but also reinforce the dollar’s status as the world’s reserve currency. Recent data shows the dollar index rose in tandem with U.S. Treasury yields from a low of 97.4880 to a high of 99.6887, showing a strong positive correlation. This linkage arises because when bond yields rise, investors prefer to return to dollar assets to hedge global risk exposure. Fundamentals supporting this include the Fed’s Beige Book reporting modest economic growth, continued price increases, stable employment, and a lower probability of rate cuts. The CME FedWatch tool shows that expectations for keeping rates unchanged at the March 18 meeting remain dominant. In addition, the upcoming weekly jobless claims data on Thursday and Friday’s February employment report will serve as key catalysts for bond yield volatility. If data is stronger than expected, upward pressure on yields will intensify, supporting the dollar’s resilience in the 98.7–99.2 range.
Unlike standard analysis, this article emphasizes bond market yields as the core driver of dollar movement, rather than simply relying on exchange rates or trade factors. For example, Middle East tensions heightening energy supply concerns directly trigger bond market selling and higher yields, which in turn reinforce the dollar’s safe-haven appeal, rather than viewing the dollar as an independent variable. The dollar index is now quoted at 98.9877, running near the Bollinger middle band at 98.9046, with the upper band at 99.1359 as resistance and the lower at 98.6733 as support. The bands flatten, indicating a consolidation structure. The MACD red bar has expanded moderately, and after a golden cross at the lower level, the fast and slow lines ticked higher, signifying the existence of a weak short-term rebound momentum. Observing the single-sided rally since February 28, the dollar swiftly rose from around 97.6 to the peak of 99.68, later retraced and entered high-level oscillation, with prices still above the rally’s launching platform. This aligns closely with the synchronous recovery of U.S. Treasury yields: during the yield rally, the dollar benefits from capital inflow; when the yield rally loses momentum, the dollar may shift to range-bound consolidation. For the next 2–3 days, watch whether the 4.103% mid-band support for yields holds—if it does, the dollar index is expected to test the 99 mark; if yields fall back, dollar downside risks shift to the 98.6733 support.
Transmission Analysis of Bond Market Volatility on Gold's Safe-haven Effect
Spot gold, amidst rising bond yields, displayed a classic tug-of-war between safe-haven demand and opportunity cost. The current quote is 5165.95 USD/oz, with a local high of 5419.01 USD/oz and a recent low of 4996.33 USD/oz. From February 28 to March 3, gold surged from around 5150 USD to a historical high of 5419 USD, breaking its usual negative correlation to the U.S. dollar and Treasuries primarily under the influence of safe-haven demand amid escalating Middle East tensions. Israel’s strikes against Iranian infrastructure led millions to seek shelter, amplifying global uncertainty, and gold benefited as a traditional safe-haven asset. Even as the dollar strengthened, gold’s rally exceeded expectations thanks to dominant geopolitical risks. However, on March 4, a single-day plunge of over 400 USD occurred, with prices returning to the central range of the previous consolidation platform, reflecting a short-term peak in safe-haven sentiment and the emergence of the suppressive effect of bond market transmission.
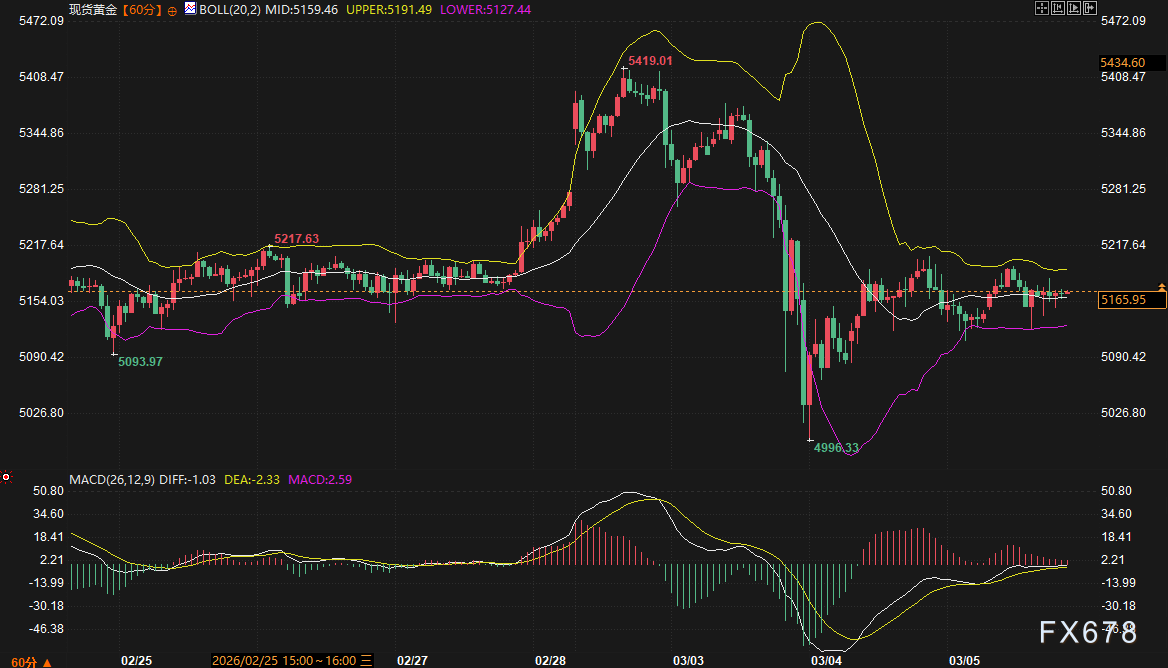
From a fundamental perspective, Middle East tensions continue to escalate—including Iran’s warning to Washington and the sunken warship incident—further boosting energy prices and sparking inflation concerns. This has a dual effect on gold: on one hand, long-term inflation expectations continue to benefit gold as a hedge; on the other hand, higher bond yields directly increase the opportunity cost of holding gold, especially when the Fed’s rate-cutting path is blocked. Renowned institutional analysts point out that while Middle East conflict may strengthen demand for gold’s safe-haven role, persistently high energy prices could keep interest rates higher for longer, thus capping gold’s upside. On Thursday, gold rose modestly by 0.4% to 5156.11 USD/oz (UTC+8), with April futures up 0.7% to 5168.20 USD/oz (UTC+8), partly due to safe-haven buying, but further upside was limited as the dollar rebounded to the 99.00 area. Technically, Bollinger Bands show prices oscillating near the middle band at 5159.46 USD, with 5191.49 USD as near-term resistance and 5127.44 USD as support, and the bands narrowing into a consolidation mode. The MACD red bar continues to shrink, the rebound’s momentum is fading, and after a golden cross at the low, the slopes of the fast and slow lines moderate, signaling a consolidation repair stage.
The difference in this analysis lies in focusing on the bond-market-driven safe-haven effect rather than a generalized discussion of gold’s negative correlation with the dollar. When yields rise, real rates rise and suppress gold, but if Middle East tensions trigger broader safe-haven flows, bond market volatility could indirectly boost gold demand. For example, during the rally of Treasury yields from 3.925%, gold surged against trends but then reverted to negative correlation; after the plunge, its consolidation reflects bond market pressure transmission. In the short term, watch the 5127 USD lower band support—if bond yields continue to rise, the risk of gold probing lower increases; if yields stagnate, gold’s recovery rebound could target the 5200 USD mark. Intraday, focus on energy price moves: if oil breaks above 78 USD, bond selling pressure will intensify, further suppressing gold; also, if weekly jobless data show resilient employment, Fed policy expectation changes will further impact the bond-gold transmission chain.
Cross-correlation and Short-term Equilibrium among the Three Instruments
Over the past 10 trading days, the performance of the three instruments has fully matched the classic negative correlation logic of major asset classes, but incorporating a bond market perspective provides a more nuanced read. During the synchronous rally phase (Feb 28–Mar 3), U.S. Treasury yields rebounded quickly from 3.925%, the dollar rose, and both reflected the cooling of Fed rate cut expectations; gold’s surge was a safe-haven-driven idiosyncratic rally, breaking the usual relationship. In the phase of return to negative correlation (from March 4 to present), Treasury yields continued to spike, the dollar entered high-level oscillation, and gold, after plunging, consolidated—restoring the logic: higher yields raise gold’s opportunity cost, and a stronger dollar further suppresses it. The current stage is one of equilibrium: bond yield momentum wanes, the dollar oscillates, and gold finds support, negative correlations weaken, and a window opens for directional choices.
Merging fundamentals and technicals, uncertainty over the Middle East, the evolving Israel-U.S.-Iran dynamic (elections, existential threats, regime calculations), and rebounding energy prices dominate the bond market’s volatility transmission. The dollar benefits from safe-haven capital inflows, but if bond yield momentum falters, its upside will be capped; gold’s safe-haven effect depends on bond market pressure abating, opening a repair window if yields fall. Support/resistance zone forecasts: for the 10-year U.S. Treasury yield (June contract), support is at 4.103% (Bollinger mid-band, logic: retreat after momentum wanes), resistance at 4.13% (recent breakout level, driven by energy); for the dollar index, support at 98.6733 (lower Bollinger band, logic: oscillation lower boundary), resistance at 99.1359 (upper band, depending on bond market support); for spot gold, support at 5127 USD (lower Bollinger band, logic: post-plunge repair support), resistance at 5191 USD (upper band, based on safe-haven rebound). Intraday, watch the immediate impact of energy prices and jobless data on the bond market, and avoid interpreting technical indicators in isolation from fundamental drivers.
Outlook for Future Trends
In the next 2–3 days, the performance of all three assets will be highly dependent on the direction of U.S. Treasury yields. If yields break above 4.13%, the dollar index may feel resistance at 99, but overall remain in oscillation between 98.7–99.2; gold will see a rising probability of a test of the 5127 USD support, with safe-haven effects suppressed by higher opportunity costs. If yields stagnate and retreat, the dollar will enter a weak consolidation, gold will see a recovery rebound aiming for the 5200 USD mark, and the negative correlation among U.S. Treasuries, the dollar, and gold will further weaken. Overall, the market has entered a window of equilibrium, and volatility will mainly be consolidation-based, with attention on Middle East developments and employment data transmission to the bond market.
【FAQ】
Question 1: How do Middle East tensions affect U.S. Treasury yields and the safe-haven effect of gold?
Answer: The escalation of the Middle East crisis directly pushes a rebound in energy prices, amplifying inflation expectations and intensifying the selling pressure on U.S. Treasuries, which causes yields to rise. As these swings transmit to gold, on one hand safe-haven demand is boosted, allowing for moderate price rebounds; on the other, higher opportunity costs limit gold’s upside. In the short term, this dual effect keeps gold in a consolidation stage, and the future depends on whether the crisis boundaries become clearer.
Question 2: What is the logic behind the dollar index consolidating at highs, and how is it linked to U.S. Treasuries?
Answer: The dollar index rallied from 97.6 to 99.68 before entering consolidation, mainly due to safe-haven inflows but also supported by rising Treasury yields: higher yields enhance the appeal of dollar assets, forming a positive correlation. If yield momentum runs out, the dollar may pull back to 98.6733 support. Fundamentals include changing Fed policy expectations, and employment data will strengthen this transmission.
Question 3: What is the technical basis for gold’s consolidation after its plunge?
Answer: After the drop, gold consolidated near the 5159 USD mid-band, with narrowing Bollinger Bands and a shrinking MACD red bar revealing fading momentum. This reflects that after a safe-haven peak, bond market pressure dominates: rising yields suppress gold, but if yields fall back, the effectiveness of the 5127 USD support will determine the scope for a rebound. Intraday, monitor energy dynamics for their impact on this balance.
Question 4: What changes have occurred in the negative correlation of the three instruments recently?
Answer: Initially, gold’s rally broke the negative correlation due to Middle East safe-haven demand; then, the classic logic returned with rising Treasury yields suppressing gold and supporting the dollar. Currently, the market is at equilibrium and the negative correlation has weakened; the direction in the next 2–3 days will depend on whether U.S. Treasury yield momentum stalls.
Question 5: What are the bases for short-term support and resistance ranges?
Answer: Ranges are primarily based on 60-minute technical indicators such as Bollinger Band channels and MACD momentum. Treasury support at 4.103% comes from the mid-band logic, resistance at 4.13% is the breakout point; dollar support at 98.6733 is from lower band logic; gold support at 5127 USD is the lower band, resistance at 5191 USD is the upper band. These ranges incorporate fundamentals, such as energy and employment data, to avoid deviating from market reality.
Disclaimer: The content of this article solely reflects the author's opinion and does not represent the platform in any capacity. This article is not intended to serve as a reference for making investment decisions.
You may also like
Bilibili's Q4 2025: The Profit Beat Was Priced In, the Revenue Miss Wasn't
Iran Tensions: Cryptocurrency Movement Response and Divergence
Ladbrokes parent company discloses £500m loss due to Reeves’s tax increase
The Dow plunges 750 points as higher oil prices keep inflation fears alive