
Bitcoin Faces On-Chain Air Gap To $81,000: Will Momentum Build?

By:Newsbtc
Data of the Bitcoin URPD shows a supply chasm exists between $72,000 and $81,000, potentially making resistance in the region relatively light.
Bitcoin URPD Signals Air Gap Until $81,000
In a new post on X, analyst Ali Martinez has talked about how Bitcoin support and resistance levels are looking from the perspective of the UTXO Realized Price Distribution (URPD). This indicator tells us about the amount of supply that was last transacted or purchased at the various price levels that BTC has visited in its history.
Below is the chart shared by Martinez that shows the URPD for Bitcoin as it currently stands.
var rnd = window.rnd || Math.floor(Math.random()*10e6); var pid607465 = window.pid607465 || rnd; var plc607465 = window.plc607465 || 0; var abkw = window.abkw || ''; var absrc = 'https://servedbyadbutler.com/adserve/;ID=172179;size=0x0;setID=607465;type=js;sw='+screen.width+';sh='+screen.height+';spr='+window.devicePixelRatio+';kw='+abkw+';pid='+pid607465+';place='+(plc607465++)+';rnd='+rnd+';click=CLICK_MACRO_PLACEHOLDER'; document.write('
');
if (!window.AdButler){(function(){var s = document.createElement("script"); s.async = true; s.type = "text/javascript";s.src = "https://servedbyadbutler.com/app.js";var n = document.getElementsByTagName("script")[0]; n.parentNode.insertBefore(s, n);}());}
var AdButler = AdButler || {}; AdButler.ads = AdButler.ads || []; var abkw = window.abkw || ""; var plc366606 = window.plc366606 || 0; (function(){ var divs = document.querySelectorAll(".plc366606:not([id])"); var div = divs[divs.length-1]; div.id = "placement_366606_"+plc366606; AdButler.ads.push({handler: function(opt){ AdButler.register(172179, 366606, [728,90], "placement_366606_"+opt.place, opt); }, opt: { place: plc366606++, keywords: abkw, domain: "servedbyadbutler.com", click:"CLICK_MACRO_PLACEHOLDER" }}); })();
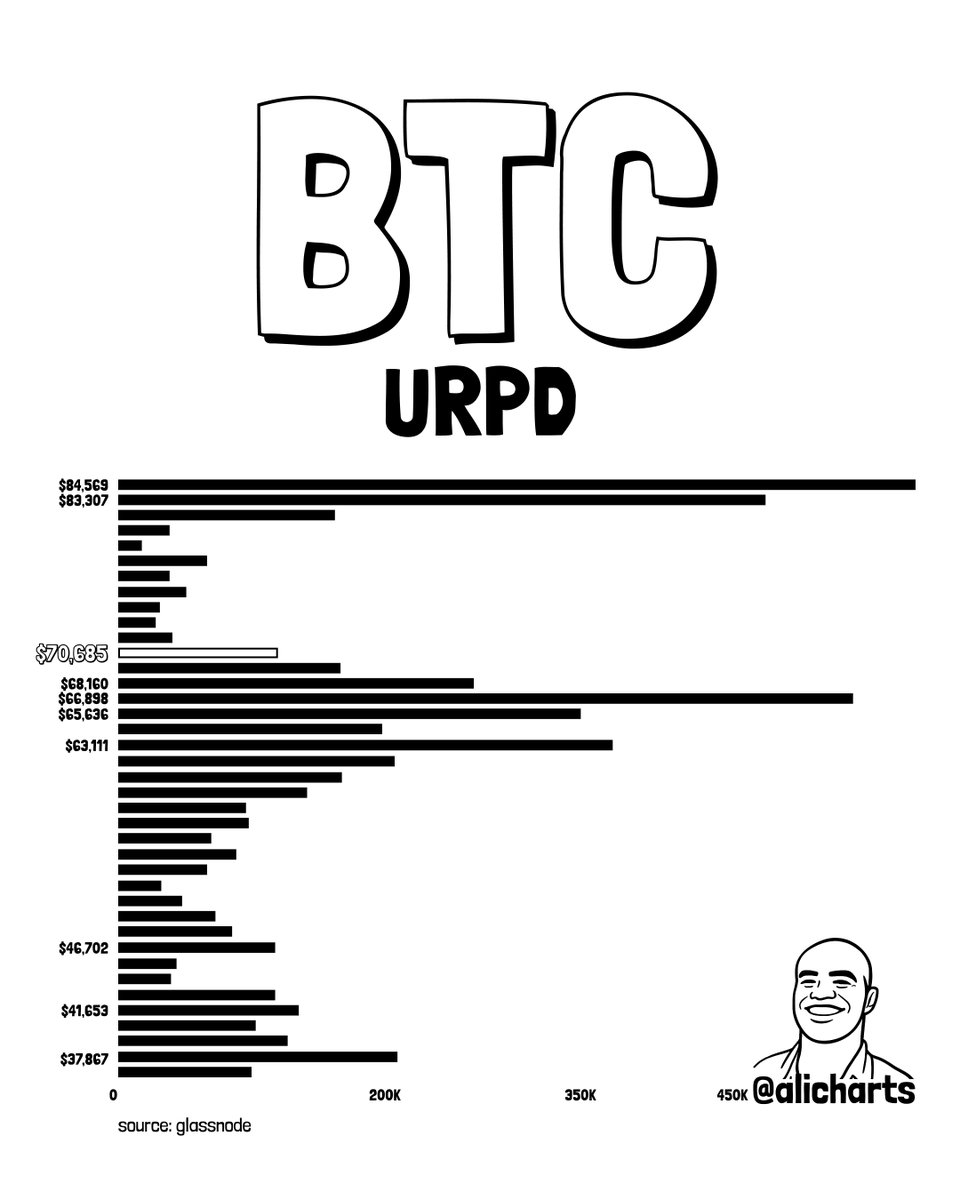
From the graph, it’s visible that the levels between $60,000 and $70,000 hold the cost basis of a notable amount of the supply. The $67,000 mark, in particular, has a huge value on the URPD.
Earlier, the bearish price action had meant that Bitcoin slipped all the way to the $60,000 level. What had followed the decline was a consolidation period in the region below $70,000. As the price moved sideways here and trading occurred, supply saw repricing into levels falling inside the range, which is potentially why the region is now looking so dense on the URPD.
This week, Bitcoin has finally seen a breakout above $70,000, meaning that it’s now past the dense zone. As is apparent from the chart, the nearby levels in the up direction only hold a relatively small share of the supply.
var rnd = window.rnd || Math.floor(Math.random()*10e6); var pid607472 = window.pid607472 || rnd; var plc607472 = window.plc607472 || 0; var abkw = window.abkw || ''; var absrc = 'https://servedbyadbutler.com/adserve/;ID=172179;size=0x0;setID=607472;type=js;sw='+screen.width+';sh='+screen.height+';spr='+window.devicePixelRatio+';kw='+abkw+';pid='+pid607472+';place='+(plc607472++)+';rnd='+rnd+';click=CLICK_MACRO_PLACEHOLDER'; document.write('
');
if (!window.AdButler){(function(){var s = document.createElement("script"); s.async = true; s.type = "text/javascript";s.src = "https://servedbyadbutler.com/app.js";var n = document.getElementsByTagName("script")[0]; n.parentNode.insertBefore(s, n);}());}
var AdButler = AdButler || {}; AdButler.ads = AdButler.ads || []; var abkw = window.abkw || ""; var plc452518 = window.plc452518 || 0; (function(){ var divs = document.querySelectorAll(".plc452518:not([id])"); var div = divs[divs.length-1]; div.id = "placement_452518_"+plc452518; AdButler.ads.push({handler: function(opt){ AdButler.register(172179, 452518, [728,90], "placement_452518_"+opt.place, opt); }, opt: { place: plc452518++, keywords: abkw, domain: "servedbyadbutler.com", click:"CLICK_MACRO_PLACEHOLDER" }}); })();
Generally, when the market mood is bearish, investors in loss can react to surges to their acquisition level by exiting the market. They may do so fearing that the price rally is only temporary and that they could fall underwater again. Due to this, large levels of the URPD that are situated above the spot price can act as potential centers of resistance in the future.
Since the $72,000 to $81,000 price range is relatively thin with supply right now, it may not provide too much resistance to Bitcoin. As the analyst explains, “if momentum builds, there is open air in that range.” For momentum to build, the support levels below might have to hold first. Just like how large supply zones above can provide resistance, those below can act as support cushions instead. This happens as investors accumulate more to defend their acquisition level.
As the Bitcoin market sentiment has been quite bearish recently, it remains to be seen whether dips into the supply cluster at $70,000 and below will be met with buying.
var rnd = window.rnd || Math.floor(Math.random()*10e6); var pid607473 = window.pid607473 || rnd; var plc607473 = window.plc607473 || 0; var abkw = window.abkw || ''; var absrc = 'https://servedbyadbutler.com/adserve/;ID=172179;size=0x0;setID=607473;type=js;sw='+screen.width+';sh='+screen.height+';spr='+window.devicePixelRatio+';kw='+abkw+';pid='+pid607473+';place='+(plc607473++)+';rnd='+rnd+';click=CLICK_MACRO_PLACEHOLDER'; document.write('
');
if (!window.AdButler){(function(){var s = document.createElement("script"); s.async = true; s.type = "text/javascript";s.src = 'https://servedbyadbutler.com/app.js';var n = document.getElementsByTagName("script")[0]; n.parentNode.insertBefore(s, n);}());}
var AdButler = AdButler || {}; AdButler.ads = AdButler.ads || []; var abkw = window.abkw || ''; var plc452519 = window.plc452519 || 0; (function(){ var divs = document.querySelectorAll(".plc452519:not([id])"); var div = divs[divs.length-1]; div.id = "placement_452519_"+plc452519; AdButler.ads.push({handler: function(opt){ AdButler.register(172179, 452519, [728,90], 'placement_452519_'+opt.place, opt); }, opt: { place: plc452519++, keywords: abkw, domain: 'servedbyadbutler.com', click:'CLICK_MACRO_PLACEHOLDER' }}); })();
BTC Price
At the time of writing, Bitcoin is trading around $70,500, up 4% over the past week.

0
0
Disclaimer: The content of this article solely reflects the author's opinion and does not represent the platform in any capacity. This article is not intended to serve as a reference for making investment decisions.
PoolX: Earn new token airdrops
Lock your assets and earn 10%+ APR
Lock now!
You may also like
The $200 Billion Dilemma: Has the Time Come for Amazon to Issue a Dividend?
101 finance•2026/03/07 03:12
XOM | Oil Is About To Make a Move | LONG
TradingView•2026/03/07 03:12
$15.9B Unrealized Loss Hits BitMine and Strategy
Coinomedia•2026/03/07 03:09
Community banks and crypto industry ‘are allies’ in CLARITY Act debate: Exec
Cointelegraph•2026/03/07 02:57
Trending news
MoreCrypto prices
MoreBitcoin
BTC
$68,510.34
-3.60%
Ethereum
ETH
$1,992.84
-4.08%
Tether USDt
USDT
$0.9999
-0.01%
BNB
BNB
$628.04
-3.40%
XRP
XRP
$1.37
-2.65%
USDC
USDC
$1
+0.01%
Solana
SOL
$84.83
-4.06%
TRON
TRX
$0.2845
-0.32%
Dogecoin
DOGE
$0.09172
-2.32%
Cardano
ADA
$0.2605
-3.50%
How to buy BTC
Bitget lists BTC – Buy or sell BTC quickly on Bitget!
Trade now
Become a trader now?A welcome pack worth 6200 USDT for new users!
Sign up now