When will the global market correction end? Will the "2020s market" repeat the stagflation scenario of the "1970s"?

The global market is currently undergoing an adjustment triggered by external shocks, with investors facing two core questions: when will this correction bottom out, and is the current macro environment replicating the stagflation nightmare of the 1970s?
On March 7, the latest Bank of America Merrill Lynch "Flow Show" weekly report offered a relatively optimistic but conditional judgment: Signals of a bottoming correction are emerging, but have not fully materialized; and the 2020s are more likely to move towards an inflationary boom rather than a stagflationary collapse—provided that the geopolitical situation does not deteriorate further.
According to the analysis by Bank of America Merrill Lynch strategist Michael Hartnett's team, the current correction has been triggered by a combination of external shocks and excessive optimism. There are now signs that some "oversold" assets have found a bottom, but neither oil prices nor the US dollar have given comprehensive reversal signals, and the S&P 500 has not undergone sufficient price clearing (such as dropping below 6,600 points).
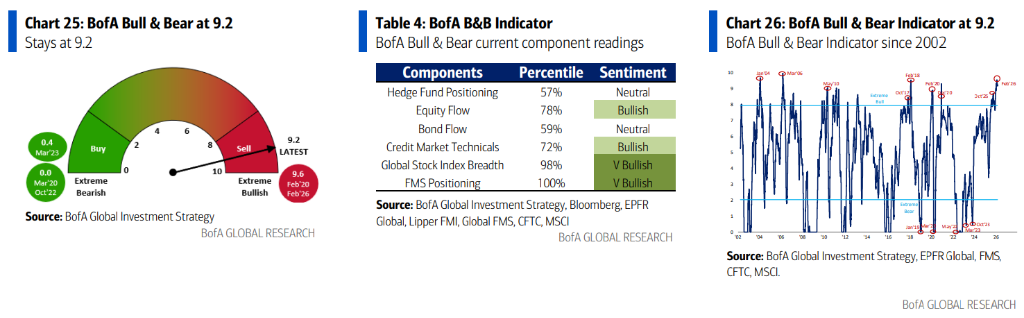
Meanwhile, the Bank of America Merrill Lynch Bull & Bear Indicator remains high at 9.2, indicating an extremely bullish range, meaning the market sentiment has not truly cooled down, thus limiting the scope for a rebound.
News from Nvidia has also sent ripples through the market: Nvidia stated that the previously announced $100 billion investment in OpenAI "is not part of the plan," and the current $30 billion financing arrangement may be the ceiling. This stance is seen as a potential signal that the exponential growth in AI capital expenditure is slowing down, which cannot be ignored in terms of its impact on tech bonds and software sectors.
When Will the Correction End? Four Conditions, Two Have Been Met
Bank of America Merrill Lynch believes that corrections triggered by external shocks under excessive optimism usually require four conditions to be met before they can be declared over:
- First, "oversold" assets find a bottom (software, MAGS, private credit, bank loans, bitcoin);
- Second, "overbought" assets are sold off (gold, semiconductors, metals, emerging markets, Europe, bank stocks);
- Third, "safe-haven assets" lose buying support (oil prices and the US dollar);
- Fourth, actual price clearing occurs.
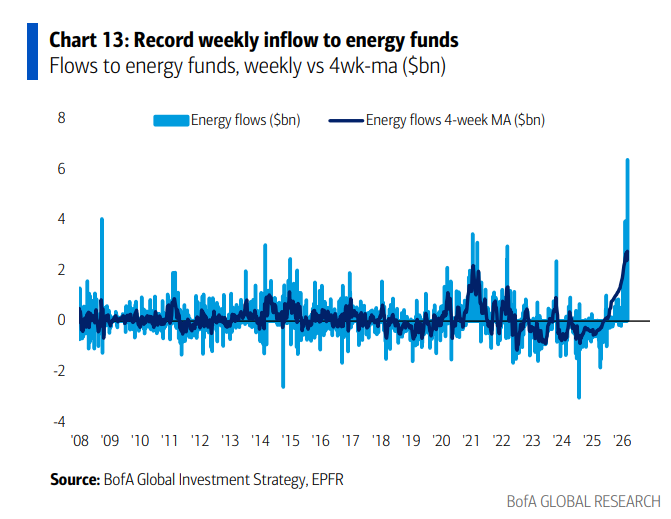
Currently, the first two conditions have begun to appear. Capital flow data confirms this judgment: This week, gold saw its largest single-week outflow ($1.8 billion) since October 2025, while the energy sector recorded its largest single-week inflow in history ($7 billion). Investors are chasing into previously overbought sectors. However, oil prices and the US dollar have not yet shown significant declines, and the S&P 500 has not seen sufficient price action cleansing.
Bank of America Merrill Lynch explicitly notes that before the US dollar's trend becomes clear, a major rebound should not be expected. The US Dollar Index is the best barometer of global liquidity—if the US dollar decisively breaks above 100, it will mean the "liquidity peak" theme is deepening, further compressing interest rate cut expectations for 2026 (the probability of a Fed rate cut on June 17 has dropped from 100% on January 1 to 37%), and could trigger yield curve flattening and an inflationary oil price shock.
From a capital flow perspective, US equities saw their largest outflow in six weeks this week ($13.9 billion), while Japanese stocks recorded the largest single-week inflow ($4.2 billion) since October 2025. Korean equities have been extremely volatile, with a record single-day inflow of $6.1 billion on March 2, followed by a record single-day outflow of $4.7 billion on March 4.
Will the 2020s Repeat the Stagflation Scenario of the 1970s?
This is one of the most controversial macro narratives on the market right now. Bank of America Merrill Lynch’s position is: the 1970s are the closest historical parallel for the 2020s, but the two are not completely equivalent; under the base-case scenario, the 2020s are more likely to experience an inflationary boom, not a stagflationary collapse.
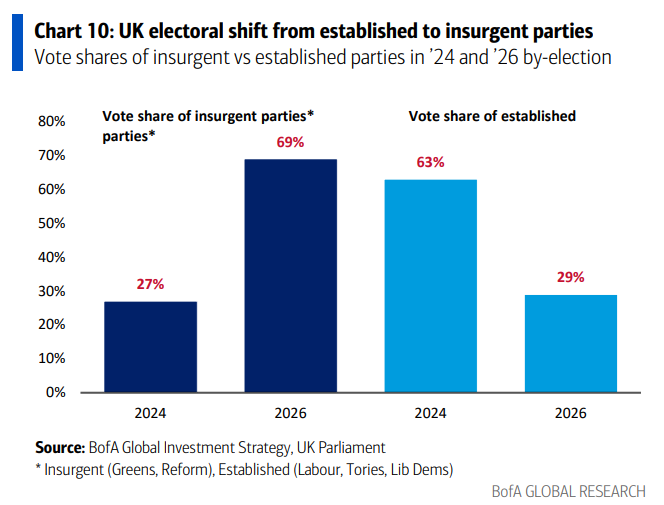
The logic supporting the inflationary boom scenario is clear: political populism (in the UK election, non-establishment party vote share surged from 27% in 2024 to 69% in 2026), reversal of globalization via tariffs and immigration policy, excessive fiscal expansion, Federal Reserve policy compromise, and asset/wealth inflation driven by the "too big to fail" stock market.
These factors collectively generate inflationary pressures, but government intervention will suppress bond yields from rising sharply, ultimately manifesting as a weaker US dollar rather than a significant rise in long-term interest rates. In this scenario, commodities, real assets, international equities and small caps will be the main beneficiaries.
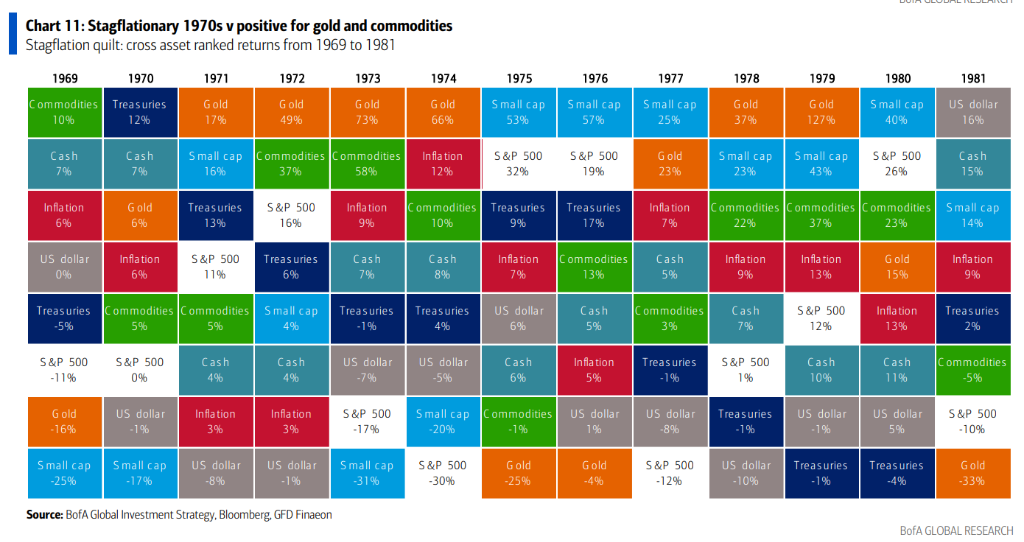
Nevertheless, the historical lessons of the 1970s are still worthy of warning. Bank of America Merrill Lynch has mapped out the full context of that era:
- From 1970 to 1972, the Nixon administration stimulated prosperity through aggressive fiscal and monetary easing, with the stock market surging more than 60%;
- From 1973 to 1974, inflation spiraled out of control and was compounded by the oil shock, causing the stock market to plunge 45%;
- From 1975 to 1976, after the first wave of inflation receded, assets rebounded, with small caps and value stocks replacing the "Nifty Fifty" as new leaders;
- From 1977 to 1980, the Iranian revolution triggered a second wave of inflation, the stock market fell another 26%, and things did not stabilize until the Volcker shock.
Applied to the present, Bank of America Merrill Lynch believes the key variable is the Iranian situation. If the conflict is brief, oil prices stay below $90/barrel, and the inflationary boom narrative holds, commodities, emerging markets, and small caps will benefit once the dollar bear market resumes. However, if the conflict drags on (such as the Strait of Hormuz blockade or Iranian attacks on regional oil infrastructure), and oil prices break through $100 to $120/barrel, then asset allocation will tilt towards oil, the US dollar, US tech, and global defense, with energy-import-dependent markets like Japan, Korea, and Europe under the most pressure.
Looking at the "mosaic" of asset performance in the 1970s, gold and commodities were at or near the top of the returns leaderboard in almost every year throughout the stagflation cycle, while equities and bonds performed unevenly. This historical pattern has already been reflected in the current market: year to date in 2026, oil has risen 30%, gold is up 18.3%, commodities overall are up 22.6%, the S&P 500 has edged up only 0.3%, while bitcoin has fallen more than 16%.
Nvidia Abandons $100 Billion Deal, Cracks Emerge in AI Capex Narrative
This week Nvidia stated that the previously announced $100 billion investment in OpenAI "is not part of the plan," and the current $30 billion financing arrangement may be the last. The market significance of this statement far exceeds the deal itself.
Bank of America Merrill Lynch points out that the price peak of software ETFs coincided with Nvidia's announcement of the investment in September 2023. Now, Nvidia’s withdrawal is a potential leading signal of a slowdown in the exponential growth of AI capital expenditures.
Once this trend is confirmed, it will be the best catalyst to reverse two major trades: first, the "short tech bonds" trade (represented by the widening of Oracle CDS spreads); and second, the "long semiconductors, short software" trade (the "AI Awe > AI Poverty" logic).
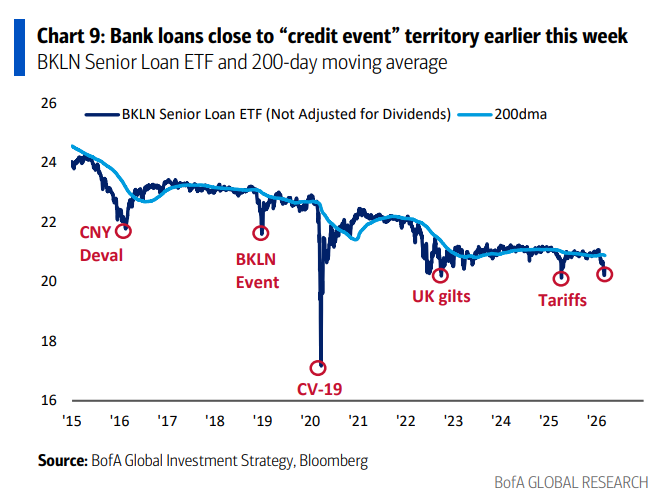
Bank of America Merrill Lynch emphasizes that the bottoming of the software sector is crucial, as its trend is highly correlated with private credit and bank loans. This week, bank loan funds saw their largest three-month outflow ($900 million), and the Bank Loan ETF (BKLN) came close to the "credit event" threshold. Strategists believe that maintaining $80 for software ETFs and $20 for Bank Loan ETFs as the February low is the key technical support for current market stability.
It is worth noting that the Bank of America Merrill Lynch Bull & Bear Indicator remains at the extremely bullish range of 9.2, issuing a sell signal. Global fund manager surveys show that emerging markets, European equities, and bank stocks are still in severely overweighted positions, indicating that if the market declines further, the sell-off pressure on these assets should not be underestimated.
Disclaimer: The content of this article solely reflects the author's opinion and does not represent the platform in any capacity. This article is not intended to serve as a reference for making investment decisions.
You may also like

Nvidia Releases Financial Results. Investors on Wall Street Respond, "Is That All?"
Patrick Bet-David’s Bombshell XRP Price Forecast if XRP Captures 5% of SWIFT Volume
The new American AI restrictions cause Nvidia stock to plunge