Expert to XRP Holders: Giga Green Candles Are Coming. Here’s the Signal

Momentum around XRP continues to build as market participants examine long-term price structure. A chart circulating presents a pattern that places it within a steady growth channel over a decade.
Crypto analyst Amonyx recently shared this chart on X with a message that captured the bullish tone spreading through the XRP community. He believes XRP will soon experience “giga green candles,” and the chart from NeocandleBTC, a YouTuber and crypto educator, backs this claim.
The chart places XRP within an ascending channel that began forming shortly after its launch. Price movements since then show repeated reactions at key areas within the structure. The pattern now sits near another critical point.
Giga green candles incoming ! $XRP 💹
Via @NeocandleBTC pic.twitter.com/pCneDTufls
— Amonyx (@amonyx) March 7, 2026
Long-Term Channel Defines XRP’s Structure
The chart highlights a large upward channel marked by two blue trendlines. These lines contain XRP’s long-term price movement from the early years through the present cycle.
Several moments stand out within this structure. One circle appears around 2017. XRP touched the lower boundary of the channel before a rapid surge followed. That rally pushed the asset to its previous peak. A similar reaction appears in 2024 during a consolidation phase. XRP touched the lower trendline again, and a 500% surge followed.
Price activity remained within the rising boundaries while gradually moving upward over time. The current market position resembles those earlier setups. XRP recently returned to the lower region of the channel.
This repeated interaction with the same structural level creates a pattern that traders often watch closely. The price tends to accelerate after revisiting this support area.
We are on X, follow us to connect with us :- @TimesTabloid1
— TimesTabloid (@TimesTabloid1) June 15, 2025
Current Retest Points Toward Potential Breakout
Recent price activity shows XRP testing the lower boundary of the channel again while remaining inside the broader upward structure. The yellow trendline drawn across prior highs also adds context. It represents long-term resistance that developed after XRP’s major rally years ago.
XRP surpassed this level in 2025 when it reached its all-time high, and now sits near the intersection of that resistance line and the channel’s lower support area. The chart points toward levels approaching $60 on the vertical axis. The chart does not present this path as guaranteed, but shows the direction price could follow if the structure continues to hold.
Disclaimer: The content of this article solely reflects the author's opinion and does not represent the platform in any capacity. This article is not intended to serve as a reference for making investment decisions.
You may also like
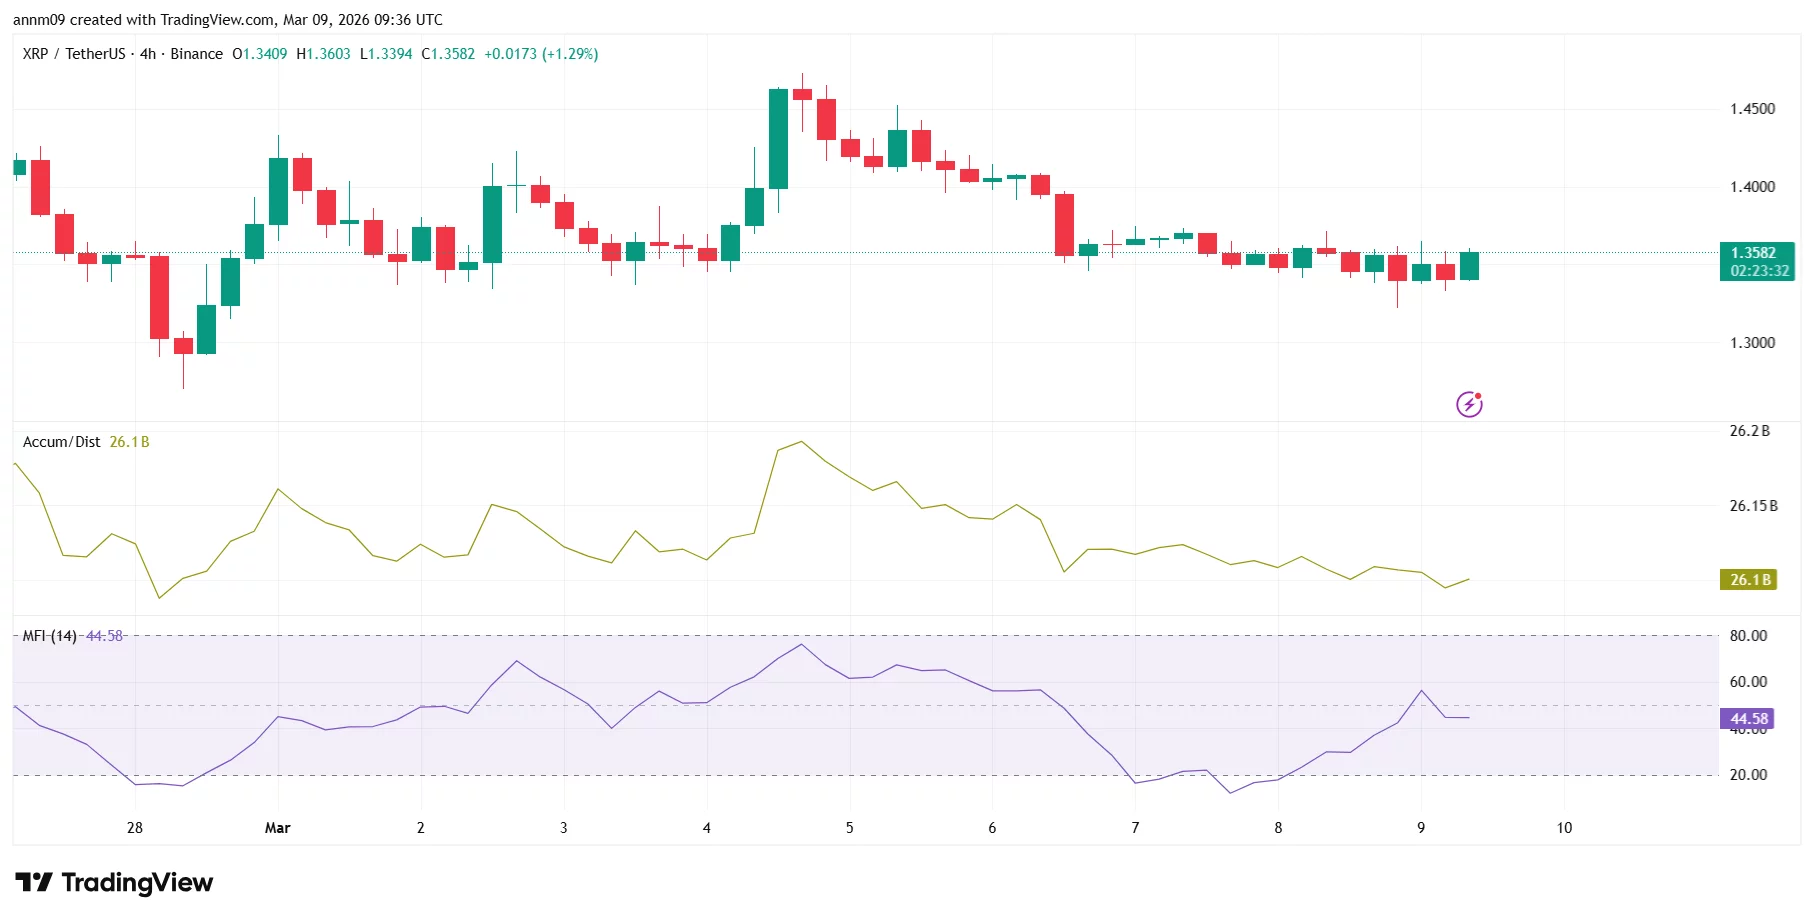
XRP price prediction: Can $1.35 hold amid massive 400M barrel oil dump?
AI's Impact on Employment: Examining Unemployment Trends and Economic Adaptability
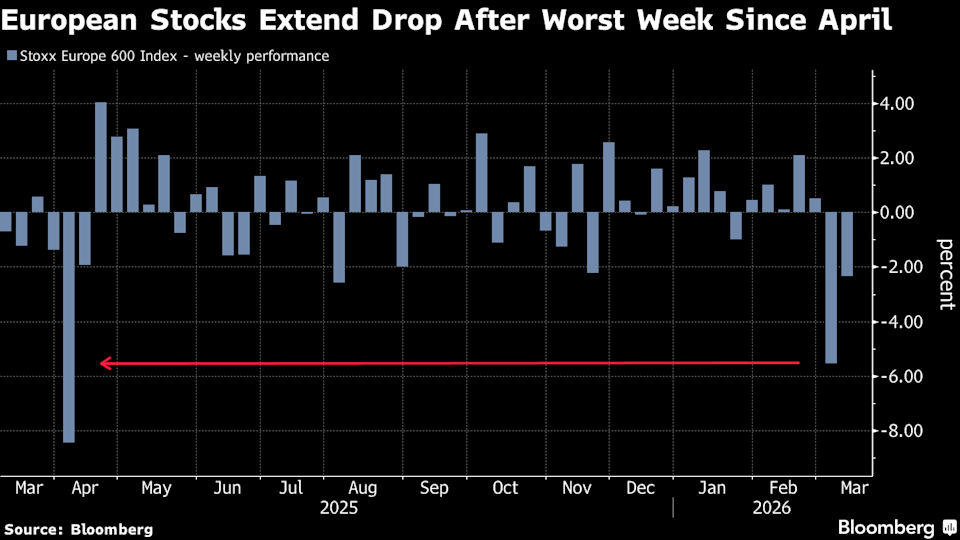
European blue chip stocks face a downturn amid rising oil prices
Les grandes banques parient contre la chute d'ETH sous 2000 $